Figures & data
Table 1. Distributions of pollutant concentrations and percent contribution of each PM2.5 component to PM2.5 total mass, New York State, 2000–2005.
Table 2. Correlations between ambient outdoor PM2.5, O3, and temperature, by season.
Figure 1. Seasonal trends in average daily PM2.5 total mass and species concentrations, New York State, 2000–2005.
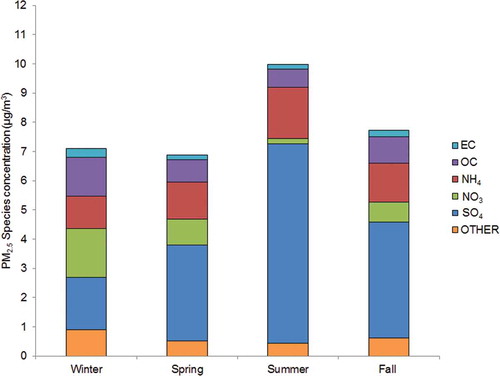
Figure 2. Year-round and season-stratified hazard ratios (HRs) of respiratory hospitalization for 0–4 day lags per IQR change in PM2.5 total mass and species, 2000–2005: (a) year-round data; (b) winter; (c) summer; (d) fall; (e) spring.
Figure 3. Mean composition of PM2.5 mass, by species mass fraction tertile: (a) high SO4, NH4, and low EC, OC, NO3, and other. (b) Low SO4, NH4, and high EC, OC, NO3, and other.
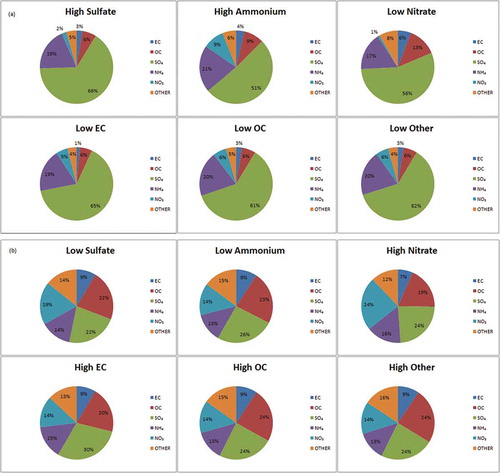
Figure 4. Hazard ratios (HRs; models adjusted for UAT) of respiratory hospitalization for 0–4 day lags per IQR change in PM2.5 total mass, 2000–2005, by tertiles of species mass fraction: (a) secondary PM2.5 species, and (b) carbon components and other PM2.5.