Figures & data
Figure 1. Map of the metropolitan Phoenix area including O3 and PM10 monitoring stations for MCAQD (labeled) and other area agencies. Note that some site locations contain monitoring stations for both O3 and PM10.
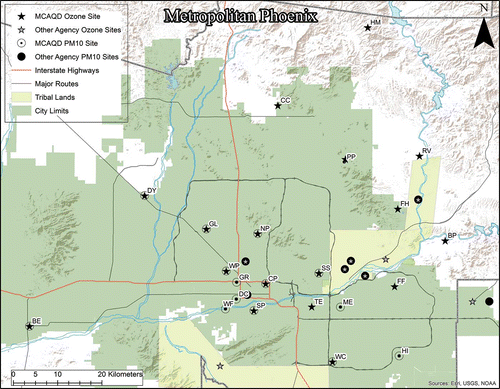
Figure 2. Map depicting pattern of average 2009 pollution concentrations in metropolitan Phoenix. (a) O3 concentrations and monitoring stations. (b) PM10 concentrations and monitoring stations. Note that though the map differentiates between MCAQD and other agency monitoring stations, this ordinary kriging interpolation was created from all stations.
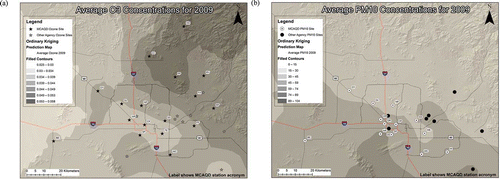
Table 1. MCAQD monitoring stations assessed within this study
Table 2. Agencies providing data and the number of monitoring stations used within this study
Figure 3. Map of southern Arizona including location of all O3 and PM10 monitoring stations used for data purposes in the study. The two largest metropolitan areas on this map are Phoenix, located in Maricopa County, and Tucson, located in Pima County to the south.
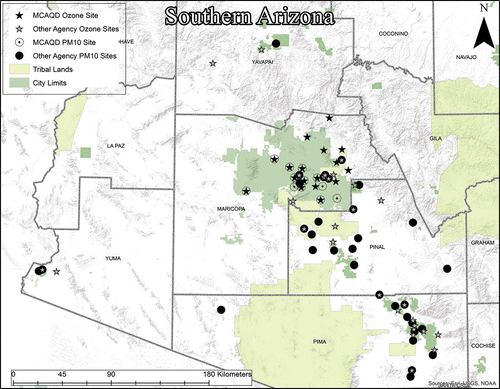
Table 3. Indicators and their categories used in Phase I and II of the study
Figure 4. The weighted spatial output model. Spatial indicators, i.e., raster maps, are inputted, reclassified, and spatially averaged to create the final spatial output map.
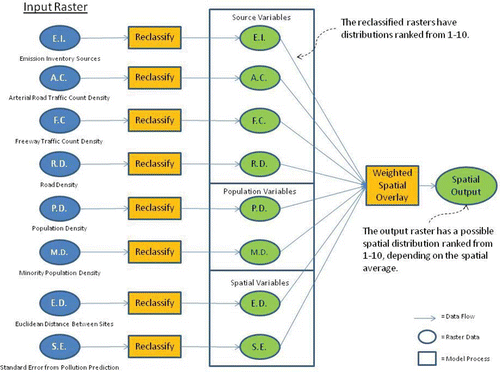
Table 4. Weights for Phase I of the study and weights for Phase II of the study
Table 5. Raw and weighted average scores and ranks for the Phase I O3 and PM10 assessment
Figure 5. (a) Radar charts of Phase I indicator results for the highest and lowest ranked O3 monitoring stations, North Phoenix and Blue Point, respectively. Labeled numbers correspond to the 11 Phase I indicators listed in . Graph gridlines each represent 0.5 points of score, from 0 to 2.0. (b) Radar charts of sustainability results for the same stations. Each sustainability group is an aggregation of the appropriate Phase I indicators. Graph gridlines each represent 0.3 points of score, from 0 to 1.2.
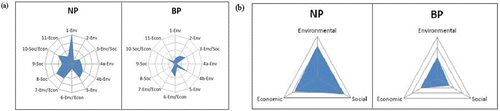
Figure 6. Map of relative sustainability results for O3 monitoring stations in MCAQD’s network. The label for each monitoring station gives its overall analysis rank.
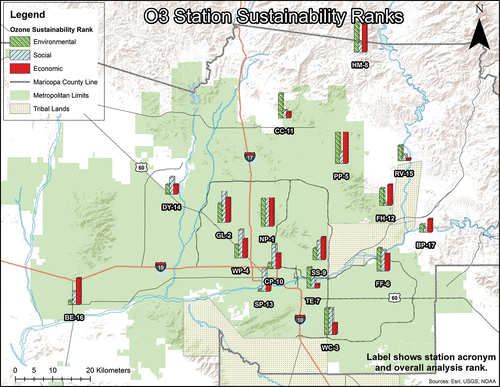
Table 6. Comparison of raw and weighted Phase I rankings for O3 and PM10 sites
Figure 7. Map of relative sustainability results for PM10 monitoring stations in MCAQD’s networks. The label for each monitoring station gives its overall analysis rank.
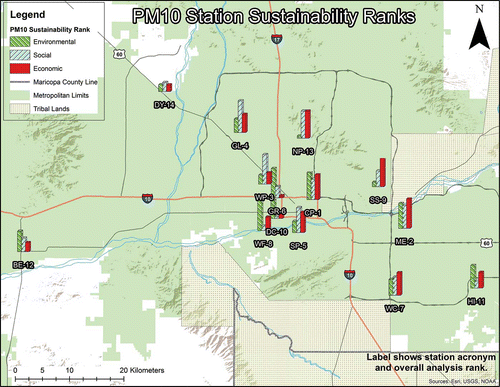
Figure 8. Scored spatial output map for the O3 Phase II analysis showing the suitability for adding additional O3 monitoring stations. Grid scores represent relative suitability for adding a new O3 monitoring station (higher score equals greater suitability). (a) Weights were added to spatial indicators before averaging the output. (b) Results from using unweighted indicators.
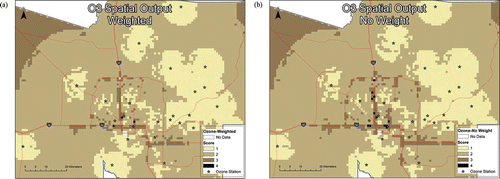
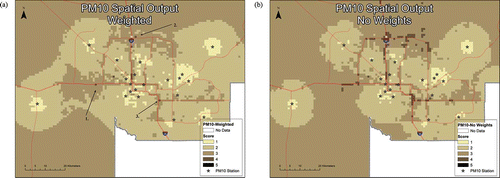
Figure 9. (a) Scored spatial output map for the PM10 analysis using weighted indicator inputs. Numbered callouts represent areas indicated for new PM10 stations, 1 = Avondale, 2 = Deer Valley, 3 = Tempe. Only two grid cells, not pictured in this map, earned a score of 5. These cells are located in western Maricopa County approximately 35 km from the western edge of this map. (b) The same analysis using unweighted indicators.