Figures & data
Figure 1. Location of the two measuring sites: Nicosia (urban) and Ayia Marina (background).
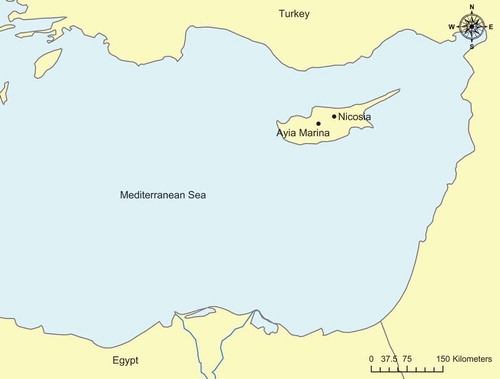
Figure 2. Annual PM10 levels for Nicosia (1993–2008) and Ayia Marina (1999–2008) in μg/m3. Dashed line shows the EU annual standard of 40 μg/m3, and error bars correspond to the 95% confidence intervals for the dust contribution.
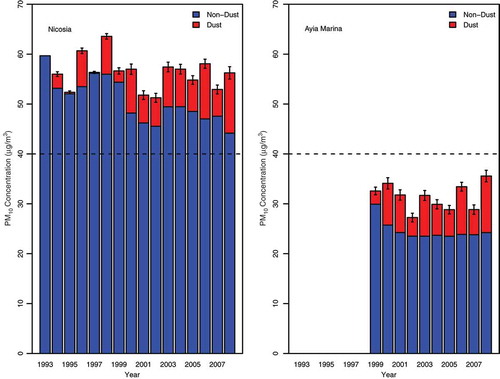
Figure 3. Monthly PM10 concentrations for Nicosia (urban), Ayia Marina (background), and urban contribution in μg/m3. Error bars correspond to the 95% confidence intervals for the dust contribution.
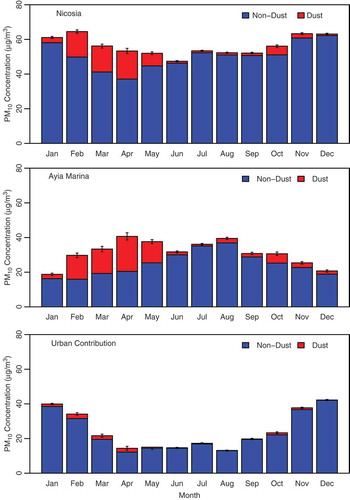
Figure 4. Annual PM10 trends adjusted for month, day of the week, desert dust storm effect, temperature, wind speed, and relative humidity for Nicosia (urban), Ayia Marina (background), and urban contribution. Dashed lines represent the 95% confidence intervals for the estimate.
Table 1. PM10 mean daily concentrations during desert dust storms and percent of days exceeding the daily EU limit of 50 μg/m3 at Nicosia and Ayia Marina site for all days and during desert dust storms
Figure 5. Number of observed dust days per year in Cyprus and fitted linear trend (dashed line).
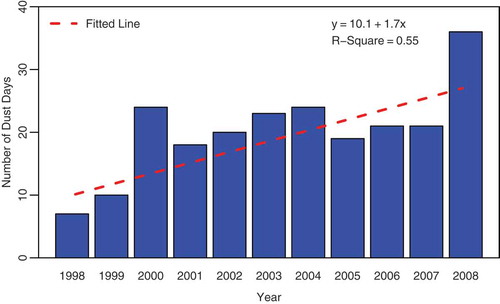
Table 2. Weekday PM10 urban source contributions
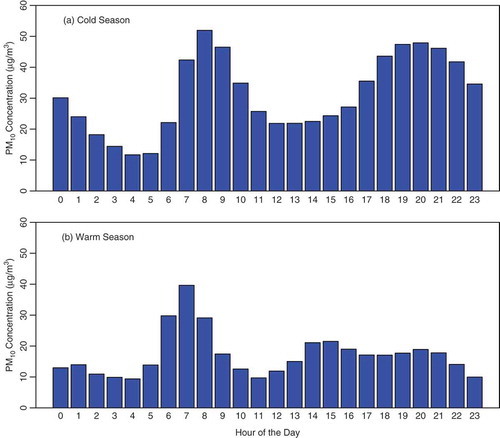
Figure 6. Urban source contributions to PM10 hourly concentrations in the (a) cold and (b) warm season, μg/m3.