
Figures & data
Figure 1. The ozone monitoring stations in the San Joaquin Valley (SJV) region of California. SJVAPCD stands for the San Joaquin Valley Air Pollution Control District. The outer box of the left panel is the California statewide 12-km modeling domain. The gray shaded and black line contours denote the gradients in topography (km), while the thick black lines show the boundaries of the SJV subregions used in model performance analysis (see Supplemental Materials for further details on model performance). Simulations for this study were conducted using the inner modeling domain at 4 km resolution that covers the entire Central Valley of California. The insert on the right shows a zoomed-in view of the site locations that were used for model performance evaluation. lists only a subset of these sites (the 10 highest 1-hr and 8-hr O3 DVs for the year 2007).
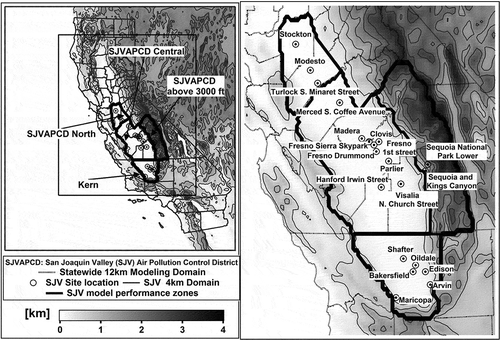
Figure 2. An illustration of the band-RRF procedure for the Edison monitoring site. The top left panel shows the time series of observed (black circles) and simulated (black line) daily maximum 1-hr O3 for the simulation period (May–September 2007). The top right panel shows the scatter plot of binned band-RRF for 1-hr O3 from 60 to 120 ppb (in 5-ppb increments) vs. the number of bands. The bottom left panel shows the time series of observed (black circles) and simulated (black line) daily maximum 8-hr O3 for the simulation period (May–September 2007). The bottom right panel shows the scatter plot of binned band-RRF from 60 to 100 ppb (in 5-ppb increments) for 8-hr O3 vs. the number of bands. S.RRF and B.RRF denote single- and band-RRFs, respectively.
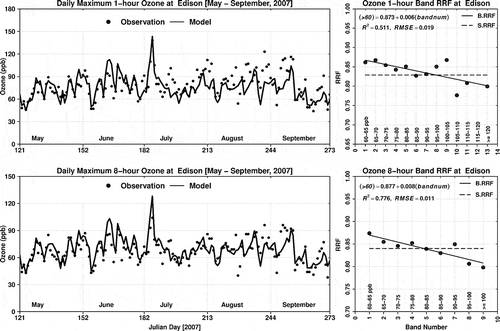
Table 1. The 2007 and 2019 O3 DVs for representative monitoring sites in the San Joaquin Valley of California; listed here are the top 10 2007 DV sites for both 1-hr and 8-hr O3
Figure 3. The total PM2.5 daily concentration ratios (2019/2007) at Modesto, Fresno, Visalia, and Bakersfield monitoring sites in the SJV region. The solid line represents the power form of the regression. (See Chen et al. [Citation2014] for further details on the simulated PM2.5 concentrations.)
![Figure 3. The total PM2.5 daily concentration ratios (2019/2007) at Modesto, Fresno, Visalia, and Bakersfield monitoring sites in the SJV region. The solid line represents the power form of the regression. (See Chen et al. [Citation2014] for further details on the simulated PM2.5 concentrations.)](/cms/asset/7065de08-b4e4-481e-ad2c-e7fb7454d289/uawm_a_936984_f0003_b.gif)