2,653
Views
11
CrossRef citations to date
0
Altmetric
Technical Papers

Assessment of nitrous oxide emission from cement plants: Real data measured with both Fourier transform infrared and nondispersive infrared techniques

, , &
Pages 1270-1278 | Received 07 Mar 2014, Accepted 16 Jun 2014, Published online: 20 Oct 2014

Figures & data

Table 1. Contribution of IPCC sectors anthropogenic emissions of N2O in Gg yr−1 in USA, OECD Europe, and China, subdivided by IPCC sectors (from EDGAR database, JRC/PBL, Citation2012)

Figure 1. N2O releases in air (t yr−1) in 2011 in Italy, and contribution (%) of each subactivity of IPCC sectors: 1 = Energy sector; 3 = Mineral industry; 4 = Chemical industry; 7 = Intensive livestock production and aquaculture. Data from E-PRTR.

Figure 1. N2O releases in air (t yr−1) in 2011 in Italy, and contribution (%) of each subactivity of IPCC sectors: 1 = Energy sector; 3 = Mineral industry; 4 = Chemical industry; 7 = Intensive livestock production and aquaculture. Data from E-PRTR.

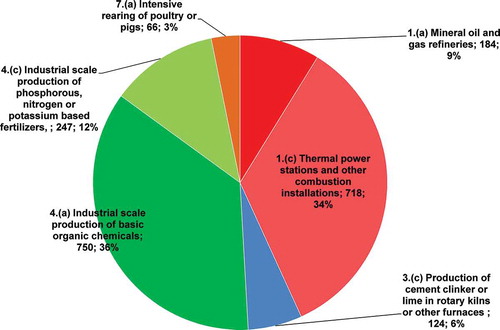
Table 2. Characteristics of the cement plants analyzed

Table 3. Average concentration of punctual measurements of N2O, NOx, CO, and CO2 on a monthly basis, collected by inline instruments installed on plants, and NOx/N2O ratio

Figure 2. Profiles of N2O and NH3 (mg Nm−3) for plants with highest N2O/NOx ratio. (a) profile of plant E; (b) profile of plant F.

Figure 2. Profiles of N2O and NH3 (mg Nm−3) for plants with highest N2O/NOx ratio. (a) profile of plant E; (b) profile of plant F.

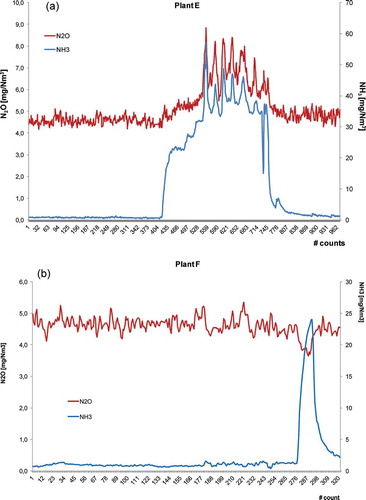
Table 4. Mean, minimum, and maximum concentrations of CO, CO2, and N2O obtained with NDIR and FTIR techniques and relative accuracy index (Iar)

Figure 3. Profiles of (a) CO (mg Nm3) and (b) CO2 (% v/v) obtained in a simultaneous sampling campaign with FTIR- and NDIR-based instruments in plant G.

Figure 3. Profiles of (a) CO (mg Nm−3) and (b) CO2 (% v/v) obtained in a simultaneous sampling campaign with FTIR- and NDIR-based instruments in plant G.

Figure 4. Profiles of N2O (mg Nm3) obtained in a simultaneous sampling campaign in plant G with FTIR- and NDIR-based instruments: good accordance in trend.

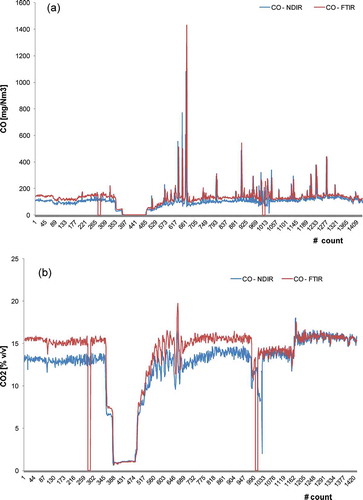
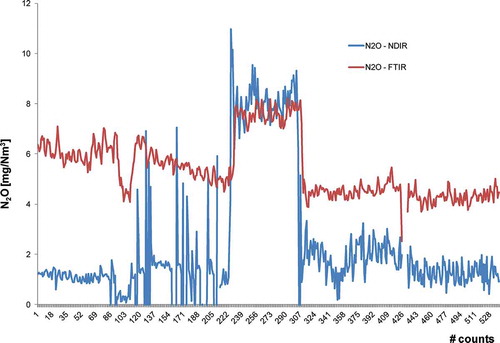
Figure 4. Profiles of N2O (mg Nm−3) obtained in a simultaneous sampling campaign in plant G with FTIR- and NDIR-based instruments: good accordance in trend.

Figure 5. Profiles of N2O (mg Nm3) obtained in a simultaneous sampling campaign in plant C with FTIR- and NDIR-based instruments.

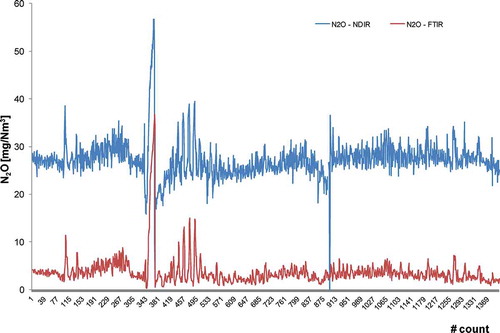
Figure 5. Profiles of N2O (mg Nm−3) obtained in a simultaneous sampling campaign in plant C with FTIR- and NDIR-based instruments.
Supplemental material

Supplemental_Material.pdf

Download PDF (90.1 KB)

Reprints and Corporate Permissions

Please note: Selecting permissions does not provide access to the full text of the article, please see our help page How do I view content?

To request a reprint or corporate permissions for this article, please click on the relevant link below:

Academic Permissions

Please note: Selecting permissions does not provide access to the full text of the article, please see our help page How do I view content?

Obtain permissions instantly via Rightslink by clicking on the button below:

If you are unable to obtain permissions via Rightslink, please complete and submit this Permissions form. For more information, please visit our Permissions help page.