
Figures & data
Figure 1. Geographical location of Xi’an sampling site in Shaanxi Province, China.
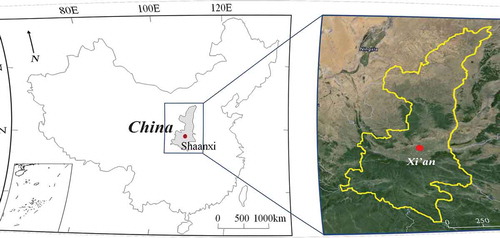
Figure 2. (a) Monthly average ambient temperatures, relative humidity (RH), and wind speeds and (b) wind rose in Xi’an.
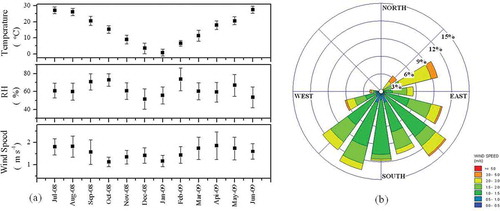
Figure 3. Temporal variation of levoglucosan mass concentrations (ng m−3) from July 2008 to June 2009. The blue lines show the monthly average concentrations and red line shows the annual average concentration.
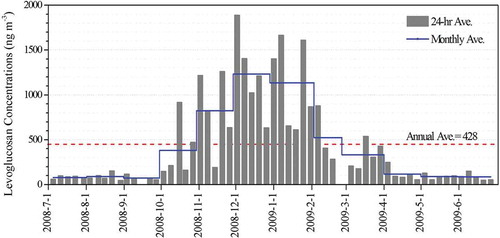
Table 1. Statistical summary of 24-hr PM2.5 chemical composition for samples acquired over spring, summer, autumn, and winter periods in Xi’an, China
Figure 4. Fire counts (red points) during the period of 5 July 2008 to 27 June 2009.
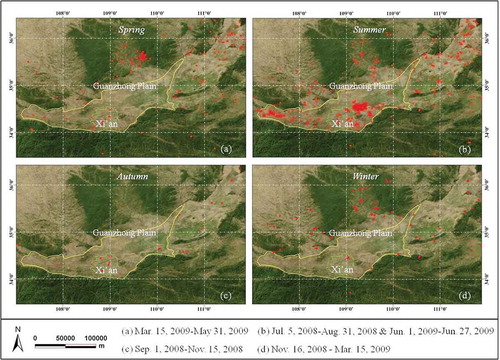
Table 2. The correlation coefficientsa between levoglucosan and other parameters
Figure 5. Correlations between levoglucosan and (a) K+, (b) OC, (c) glyoxal, and (d) Cl−. Green: spring; red: summer; yellow: autumn; blue: winter. The encircled components demonstrate fireworks during the Chinese New Year’s firework events.
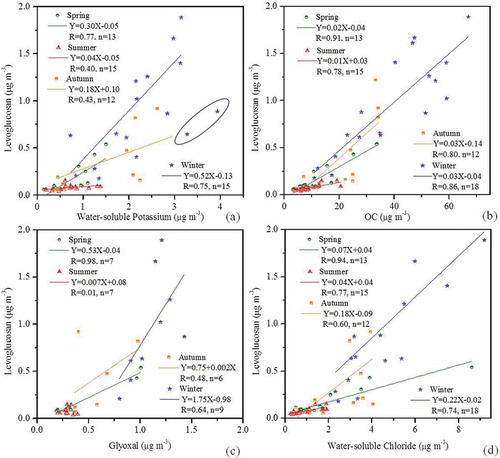
Figure 6. Scatterplot of δ13CEC versus EC/TC ratio in PM2.5.
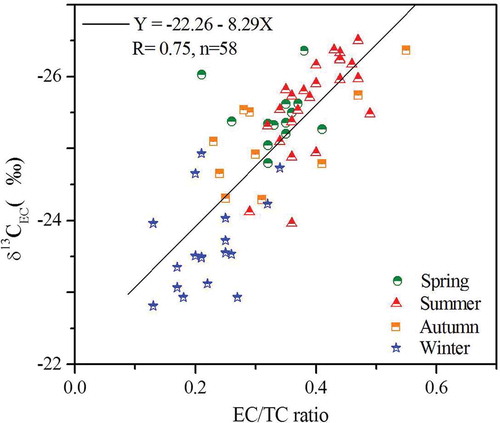
Figure 7. Monthly average contribution of biomass burning to OC.
Table 3. Comparison of average levoglucosan concentrations and levoglucosan/OC ratios for different locations