Figures & data
Figure 1. Map of Shale Creek community sampling sites. Markers with black dots inside indicate sites with both passive (NOx, SO2, speciated VOCs) and active filter samplers. Other sites had only passive samplers.
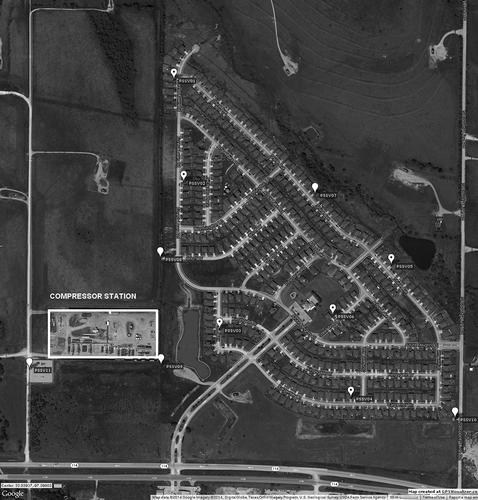
Figure 2. Star Shell Road source sample collection site: aerial view showing monitoring site locations. Symbols used are same as .
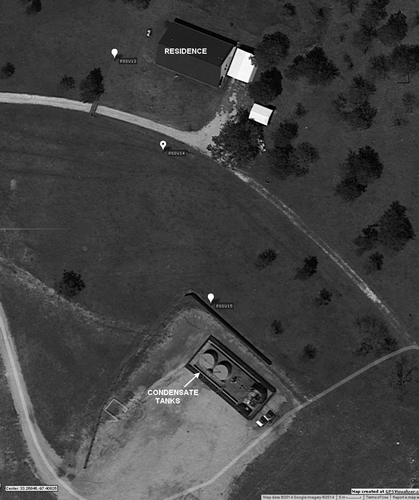
Table 1. Passive sampler types used for saturation monitoring
Table 2. VOC source profiles used for CMB receptor modeling
Figure 3. Composition of hydrocarbons in source samples collected during Phase 1. Compounds are divided into two groups: (a) C2–C5 and (b) C6–C10, to show detail. Percentages shown are volumetric.
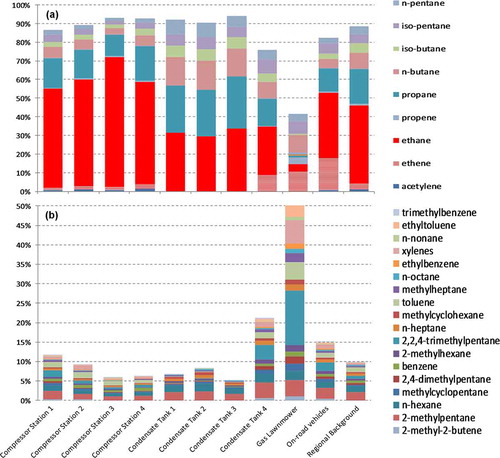
Figure 4. Composition of carbonyl compounds in source samples collected during Phase 1. Percentages shown are volumetric.
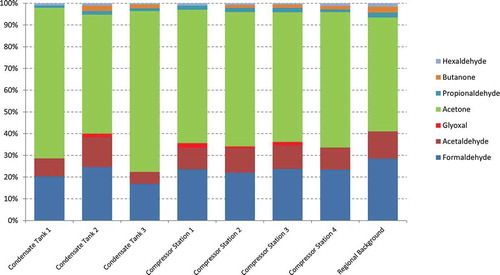
Figure 5. VOC gradient downwind of a well with condensate tank emissions. (a) Aromatics and cycloalkanes (linear scale); (b) aliphatic hydrocarbons (log scale). Concentrations are background subtracted 7-day averages for the week of May 13, 2010.
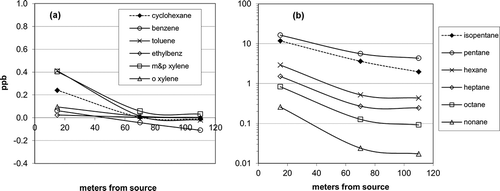
Figure 6. The concentration gradient downwind of a well with condensate tank emissions. Values are 7-day averages for the week of May 13, 2010 (week 4), normalized to the concentration nearest the well.
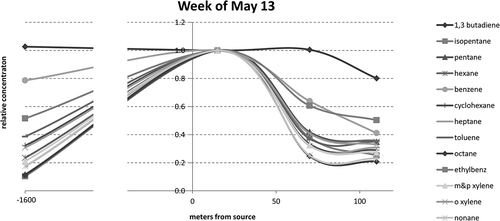
Figure 7. Aldehyde gradient downwind of a well with condensate tank emissions. Concentrations are background-subtracted averages.
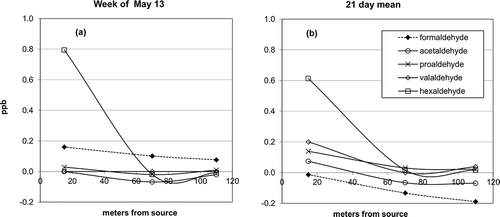
Table 3. Weekly mean of meteorology parameters from data collected at site PSSV01
Figure 8. Average (a) benzene and (b) n-pentane concentrations at Shale Creek community sites over 21 days, ordered from left to right according to increased distance from the compressor station. PSSV11: W side of compressor station; PSSV09: SE corner of compressor station, PSSSV08: NE of compressor station; PSSV01–PSSV07: residential sites in Shale Creek community; PSSV10: County Line Road; PSSV12: 1 mile S. Corresponding data from TCEQ autoGC sites are included for comparison.
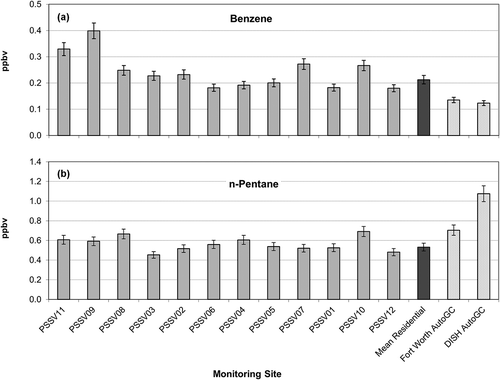
Figure 9. Mean NO and NO2 concentrations over sampling period. PSSV11: W side of compressor station; PSSV09: SE corner of compressor station, PSSV08: NE of compressor station; PSSV01–PSSV07: residential sites in Shale Creek community; PSSV10: County Line Road; PSSV12: 1 mile S. Sites are ordered according to increased distance from the compressor station. Corresponding data from a monitoring station in Fort Worth are also shown for comparison.
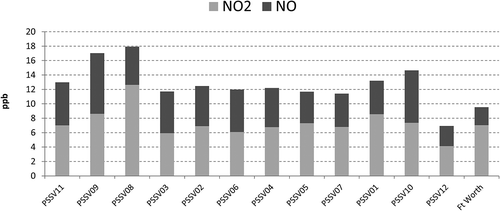
Figure 10. Composition of PM2.5 mass for all 4 weeks of sampling at Shale Creek sites. Error bars indicate the uncertainty of the gravimetric mass measurement.
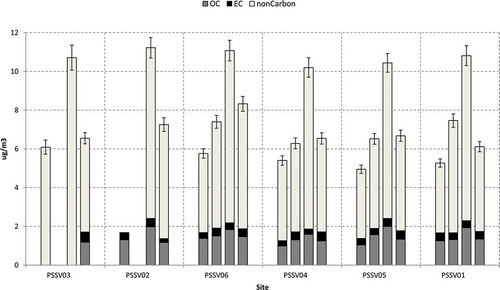
Figure 11. Average PAH concentrations at Shale Creek community sites (PSSV01–PSSV06) and Star Shell Road site (PSSV14).
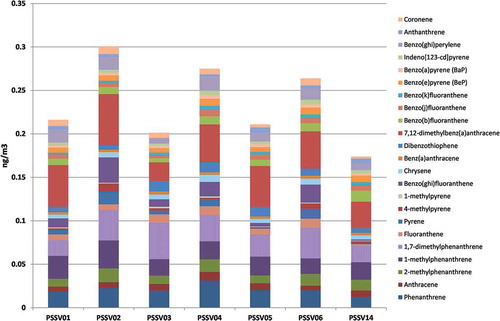
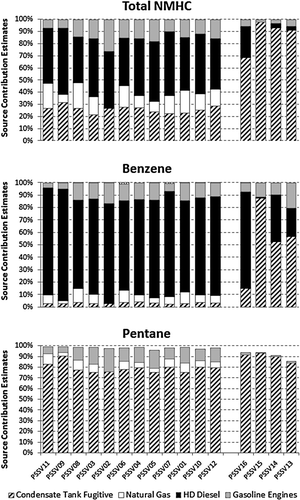
Figure 12. Mean relative source contribution estimates of four source categories to (a) total hydrocarbons, (b) benzene, and (c) pentane for each monitoring site.