Figures & data
Figure 1. Schematic of the experimental setup.
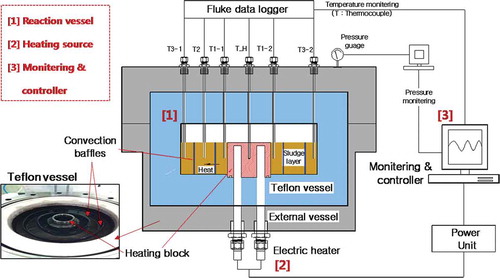
Table 1. Physicochemical characteristics of sewage sludge
Figure 2. Photographs of physical properties related to thermal hydrolysis reaction: (a) raw; (b) 80 °C; (c) 100 °C; (d) 130 °C; (e) 150 °C; (f) 170 °C; (g) 190 °C; (h) 200 °C.
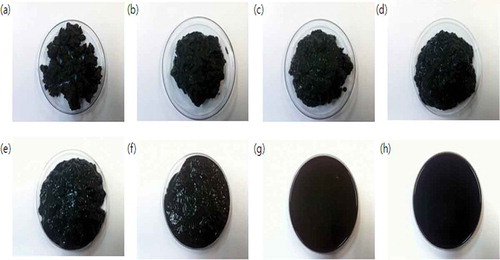
Figure 3. Temperature difference profiles of water and dewatered sludge versus reaction temperature: (a) water; (b) dewatered sludge.
Figure 4. Comparison of the temperature differences (ΔT) of water and dewatered sludge: (a) temperature difference (°C); (b) integrated electric power (kWhr).
Figure 5. Comparison of thermal conductivities of water and dewatered sludge.
Figure 6. Comparison of calculated and measured thermal conductivities of dewatered sludge.