Figures & data
Figure 1. Integrated assessment framework for estimating air quality co-benefits of U.S. climate policy. This framework first implements policies in our economic model (USREP), then estimates the resulting impacts to welfare, production, and emissions. Emissions in SMOKE are input to the air quality model CAMx to yield concentrations of fine particulate matter. Those concentrations are input to BenMAP to estimate human health impacts. Lastly, those health impacts are input to USREP to estimate the welfare impacts of fine particulate matter pollution.
Table 1. USREP model details: Regional, household, and sectoral breakdown and primary input factors
Figure 2. The 12 regions of the USREP model. They are the aggregation of the following states: NEW ENGLAND = Maine, New Hampshire, Vermont, Massachusetts, Connecticut, Rhode Island; SOUTH EAST = Virginia, Kentucky, North Carolina, Tennessee, South Carolina, Georgia, Alabama, Mississippi; NORTH EAST = West Virginia, Delaware, Maryland, Wisconsin, Illinois, Michigan, Indiana, Ohio, Pennsylvania, New Jersey, District of Columbia; SOUTH CENTRAL = Oklahoma, Arkansas, Louisiana; NORTH CENTRAL = Missouri, North Dakota, South Dakota, Nebraska, Kansas, Minnesota, Iowa; MOUNTAIN = Montana, Idaho, Wyoming, Nevada, Utah, Colorado, Arizona, New Mexico; PACIFIC = Oregon, Washington, Hawaii.
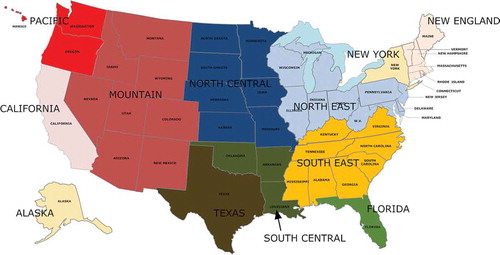
Table 2. Endpoints, epidemiologic studies, and valuations used for fine particulate matter health impacts, following EPA (Citation2012)
Table 3. Median co-benefits of each policy (total, per capita, and per ton of mitigated CO2 emissions) [range in square brackets]
Table 4. Co-benefits, costs, and net co-benefits in billions 2005$
Figure 3. Ratio of median co-benefits to the magnitude of policy costs for the CES (%). Median CES co-benefits range from 1% (in California) to 10% (in New York) of the magnitude of policy costs.
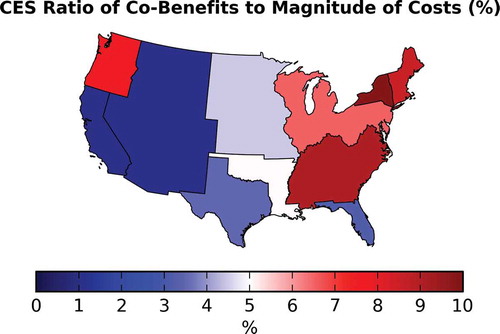
Figure 4. Ratio of median co-benefits to the magnitude of policy costs for the CAT (%). The relative welfare impact of pollution to policy implementation is greatest in the East, where co-benefits are 14 times greater than costs. Median values are plotted; for the CAT, these range from 11% to 690% and are >100% for Florida, New York, North East, and South East.
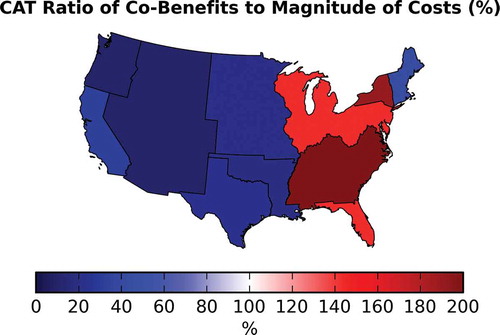
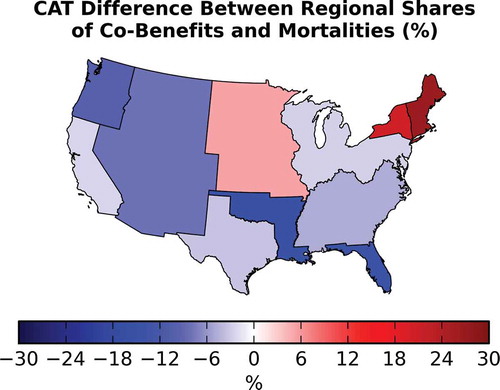
Figure 5. Median difference in the share of co-benefits from the share of mortalities (%). For the CES, each region’s share of co-benefits is different than its share of avoided mortalities. Compared with valuing mortality directly with VSL, this approach gives a distributional pattern of co-benefits that differs by as much as −25% in California to 25% in New York.
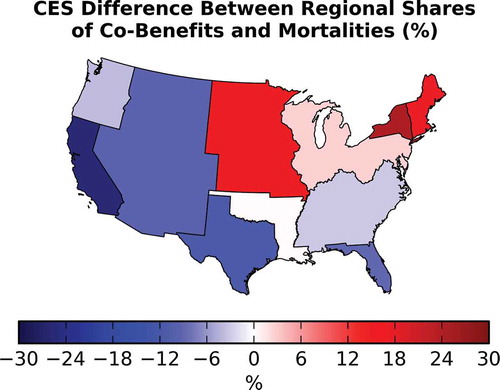
Figure 6. Median difference in the share of co-benefits from the share of mortalities (%). For seven regions, the pattern of the share of co-benefits matches that of mortalities within 10%. Using one valuation for mortality risk in all regions would overestimate co-benefits in every region except North Central, New York, and New England, and would differ in the share of co-benefits by as much as −15% in South Central to 27% in New England.