
Figures & data
Figure 1. Relative contributions of coarse and fine particles to total PM10 mass.
Figure 2. Mass closure results for (a) fine and (b) coarse particles.
Table 1. Source contributions to fine particle mass and elemental concentrations (ng/m3) at Harvard Supersite
Table 2. Source contributions to coarse particle mass and elemental concentrations (ng/m3) at Harvard Supersite
Figure 3. Annual average concentrations and standard deviations of (a) fine and (b) coarse particles.
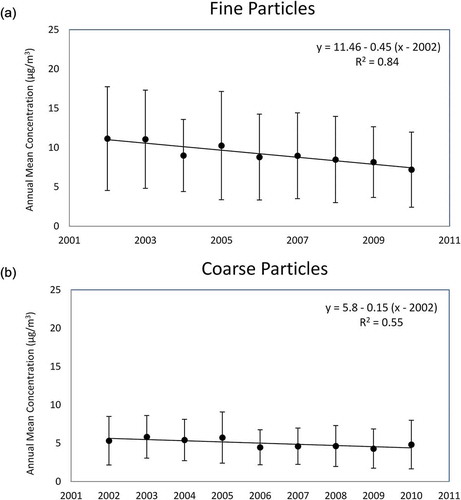
Figure 4. Seasonal average concentrations of (a) fine and (b) coarse particles.
Supplemental material