Figures & data
Figure 1. Emissions of sulfur dioxide (SO2) and total nitrogen oxides (NOx) for the entire U.S. (open circles) and only the Southeast (solid circles) as estimated by Xing et al. (Citation2013).
![Figure 1. Emissions of sulfur dioxide (SO2) and total nitrogen oxides (NOx) for the entire U.S. (open circles) and only the Southeast (solid circles) as estimated by Xing et al. (Citation2013).](/cms/asset/8d99ffd7-80a2-4253-b69a-6e6fdad6127a/uawm_a_992554_f0001_b.gif)
Figure 2. Total annual ammonia emissions by source category for 1990–2010 summed for the (a) entire U.S. and (b) only the SEARCH states Alabama, Georgia, Mississippi, and Florida (Xing et al., Citation2013).
![Figure 2. Total annual ammonia emissions by source category for 1990–2010 summed for the (a) entire U.S. and (b) only the SEARCH states Alabama, Georgia, Mississippi, and Florida (Xing et al., Citation2013).](/cms/asset/a228c212-a80c-42a8-afba-a6501029b535/uawm_a_992554_f0002_c.jpg)
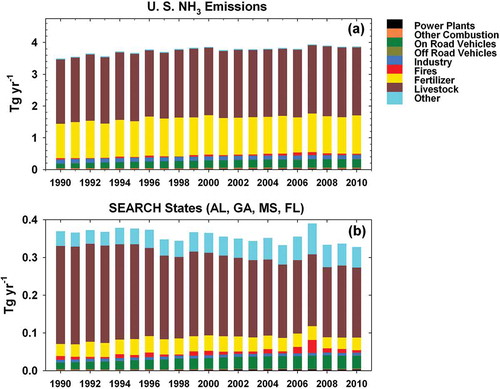
Table 1. SEARCH monitoring sites information
Figure 3. Annual statistics for gas-phase NH3 at SEARCH monitoring sites for 2004–2012. Box-whisker plots present means (solid horizontal line), medians (dotted horizontal line), and 5th, 10th, 25th, 75th, 90th, and 95th percentiles. Trend lines as estimated with a nonparametric Mann-Kendall test and using the Theil-Sen slope estimate (numerical value also shown) are presented (statistically significant trends at the α = 0.05 level are shown with a solid line; statistically insignificant trends are shown with a dashed line). Note differences in scale by site.
![Figure 3. Annual statistics for gas-phase NH3 at SEARCH monitoring sites for 2004–2012. Box-whisker plots present means (solid horizontal line), medians (dotted horizontal line), and 5th, 10th, 25th, 75th, 90th, and 95th percentiles. Trend lines as estimated with a nonparametric Mann-Kendall test and using the Theil-Sen slope estimate (numerical value also shown) are presented (statistically significant trends at the α = 0.05 level are shown with a solid line; statistically insignificant trends are shown with a dashed line). Note differences in scale by site.](/cms/asset/8ddc16c3-32f2-49c7-8d66-37fc9e4e37ff/uawm_a_992554_f0003_b.gif)
Figure 4. Annual statistics for PM2.5 NH4+ at SEARCH monitoring sites for 2004–2012. Box-whisker plots present means (solid horizontal line), medians (dotted horizontal line), and 5th, 10th, 25th, 75th, 90th, and 95th percentiles. Trend lines as estimated with a nonparametric Mann-Kendall test and using the Theil-Sen slope estimate (numerical value also shown) are presented (statistically significant trends at the α = 0.05 level are shown with a solid line; statistically insignificant trends are shown with a dashed line). Note differences in scale by site.
![Figure 4. Annual statistics for PM2.5 NH4+ at SEARCH monitoring sites for 2004–2012. Box-whisker plots present means (solid horizontal line), medians (dotted horizontal line), and 5th, 10th, 25th, 75th, 90th, and 95th percentiles. Trend lines as estimated with a nonparametric Mann-Kendall test and using the Theil-Sen slope estimate (numerical value also shown) are presented (statistically significant trends at the α = 0.05 level are shown with a solid line; statistically insignificant trends are shown with a dashed line). Note differences in scale by site.](/cms/asset/dcad1900-5d5b-4e48-a12c-d0737e1b932e/uawm_a_992554_f0004_b.gif)
Figure 5. Annual statistics for total ammonia, NHx = NH3 + PM2.5 NH4+, at SEARCH monitoring sites for 2004–2012. Box-whisker plots present means (solid horizontal line), medians (dotted horizontal line), and 5th, 10th, 25th, 75th, 90th, and 95th percentiles. Trend lines as estimated with a nonparametric Mann-Kendall test and using the Theil-Sen slope estimate (numerical value also shown) are presented (statistically significant trends at the α = 0.05 level are shown with a solid line; statistically insignificant trends are shown with a dashed line). Note differences in scale by site.
![Figure 5. Annual statistics for total ammonia, NHx = NH3 + PM2.5 NH4+, at SEARCH monitoring sites for 2004–2012. Box-whisker plots present means (solid horizontal line), medians (dotted horizontal line), and 5th, 10th, 25th, 75th, 90th, and 95th percentiles. Trend lines as estimated with a nonparametric Mann-Kendall test and using the Theil-Sen slope estimate (numerical value also shown) are presented (statistically significant trends at the α = 0.05 level are shown with a solid line; statistically insignificant trends are shown with a dashed line). Note differences in scale by site.](/cms/asset/22504d58-854b-49ec-b0a4-6e6cf6d33db4/uawm_a_992554_f0005_b.gif)
Figure 6. Annual statistics for the fraction of total ammonia in the gas phase, NH3/(NH3 + PM2.5 NH4+), at SEARCH monitoring sites for 2004–2012. Box-whisker plots present means (solid horizontal line), medians (dotted horizontal line), and 5th, 10th, 25th, 75th, 90th, and 95th percentiles. Trend lines as estimated with a nonparametric Mann-Kendall test and using the Theil-Sen slope estimate (numerical value also shown) are presented (statistically significant trends at the α = 0.05 level are shown with a solid line; statistically insignificant trends are shown with a dashed line).
![Figure 6. Annual statistics for the fraction of total ammonia in the gas phase, NH3/(NH3 + PM2.5 NH4+), at SEARCH monitoring sites for 2004–2012. Box-whisker plots present means (solid horizontal line), medians (dotted horizontal line), and 5th, 10th, 25th, 75th, 90th, and 95th percentiles. Trend lines as estimated with a nonparametric Mann-Kendall test and using the Theil-Sen slope estimate (numerical value also shown) are presented (statistically significant trends at the α = 0.05 level are shown with a solid line; statistically insignificant trends are shown with a dashed line).](/cms/asset/5dc4b909-a78e-41f7-87f4-8b80632cad5a/uawm_a_992554_f0006_b.gif)
Figure 7. Annual statistics for PM2.5 SO42− at SEARCH monitoring sites for 2004–2012. Box-whisker plots present means (solid horizontal line), medians (dotted horizontal line), and 5th, 10th, 25th, 75th, 90th, and 95th percentiles. Trend lines as estimated with a nonparametric Mann-Kendall test and using the Theil-Sen slope estimate (numerical value also shown) are presented (statistically significant trends at the α = 0.05 level are shown with a solid line; statistically insignificant trends are shown with a dashed line). Note differences in scale by site.
![Figure 7. Annual statistics for PM2.5 SO42− at SEARCH monitoring sites for 2004–2012. Box-whisker plots present means (solid horizontal line), medians (dotted horizontal line), and 5th, 10th, 25th, 75th, 90th, and 95th percentiles. Trend lines as estimated with a nonparametric Mann-Kendall test and using the Theil-Sen slope estimate (numerical value also shown) are presented (statistically significant trends at the α = 0.05 level are shown with a solid line; statistically insignificant trends are shown with a dashed line). Note differences in scale by site.](/cms/asset/21e42030-5f48-47ca-a4e1-2cc9633a2830/uawm_a_992554_f0007_b.gif)
Figure 8. Annual statistics for PM2.5 NO3− at SEARCH monitoring sites for 2004–2012. Box-whisker plots present means (solid horizontal line), medians (dotted horizontal line), and 5th, 10th, 25th, 75th, 90th, and 95th percentiles. Trend lines as estimated with a nonparametric Mann-Kendall test and using the Theil-Sen slope estimate (numerical value also shown) are presented (statistically significant trends at the α = 0.05 level are shown with a solid line; statistically insignificant trends are shown with a dashed line). Note differences in scale by site.
![Figure 8. Annual statistics for PM2.5 NO3− at SEARCH monitoring sites for 2004–2012. Box-whisker plots present means (solid horizontal line), medians (dotted horizontal line), and 5th, 10th, 25th, 75th, 90th, and 95th percentiles. Trend lines as estimated with a nonparametric Mann-Kendall test and using the Theil-Sen slope estimate (numerical value also shown) are presented (statistically significant trends at the α = 0.05 level are shown with a solid line; statistically insignificant trends are shown with a dashed line). Note differences in scale by site.](/cms/asset/5fd3a221-1e04-43ba-87a6-6429ad4537bf/uawm_a_992554_f0008_b.gif)
Figure 9. Annual statistics for the inorganic neutralization ratio NH4+/(2SO42− + NO3−) at SEARCH monitoring sites for 2004–2012. Box-whisker plots present means (solid horizontal line), medians (dotted horizontal line), and 5th, 10th, 25th, 75th, 90th, and 95th percentiles. Trend lines as estimated with a nonparametric Mann-Kendall test and using the Theil-Sen slope estimate (numerical value also shown) are presented (statistically significant trends at the α = 0.05 level are shown with a solid line; statistically insignificant trends are shown with a dashed line).
![Figure 9. Annual statistics for the inorganic neutralization ratio NH4+/(2SO42− + NO3−) at SEARCH monitoring sites for 2004–2012. Box-whisker plots present means (solid horizontal line), medians (dotted horizontal line), and 5th, 10th, 25th, 75th, 90th, and 95th percentiles. Trend lines as estimated with a nonparametric Mann-Kendall test and using the Theil-Sen slope estimate (numerical value also shown) are presented (statistically significant trends at the α = 0.05 level are shown with a solid line; statistically insignificant trends are shown with a dashed line).](/cms/asset/cc2c0078-9ac5-42cb-a153-068288f497ad/uawm_a_992554_f0009_b.gif)
Figure 10. Annual statistics for organic matter (OM) at SEARCH monitoring sites for 2004–2012. SEARCH uses an OM/OC conversion factor of 1.4. Box-whisker plots present means (solid horizontal line), medians (dotted horizontal line), and 5th, 10th, 25th, 75th, 90th, and 95th percentiles. Trend lines as estimated with a nonparametric Mann-Kendall test and using the Theil-Sen slope estimate (numerical value also shown) are presented (statistically significant trends at the α = 0.05 level are shown with a solid line; statistically insignificant trends are shown with a dashed line). Note differences in scale by site.
![Figure 10. Annual statistics for organic matter (OM) at SEARCH monitoring sites for 2004–2012. SEARCH uses an OM/OC conversion factor of 1.4. Box-whisker plots present means (solid horizontal line), medians (dotted horizontal line), and 5th, 10th, 25th, 75th, 90th, and 95th percentiles. Trend lines as estimated with a nonparametric Mann-Kendall test and using the Theil-Sen slope estimate (numerical value also shown) are presented (statistically significant trends at the α = 0.05 level are shown with a solid line; statistically insignificant trends are shown with a dashed line). Note differences in scale by site.](/cms/asset/fabfada8-b438-4979-b0d6-92575c3ce90d/uawm_a_992554_f0010_b.gif)