Figures & data
Figure 1. Overview of analytical approach to estimating climate-related ozone changes, health impacts, and economic values.
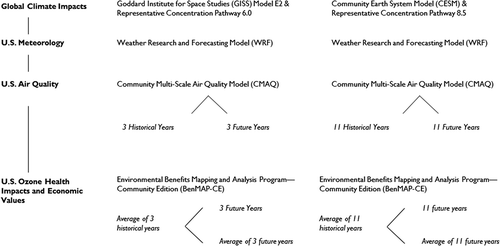
Figure 2. Projected change in average daily maximum temperature, seasonal average maximum daily 8-hr ozone, and ozone-related premature deaths in 2030.
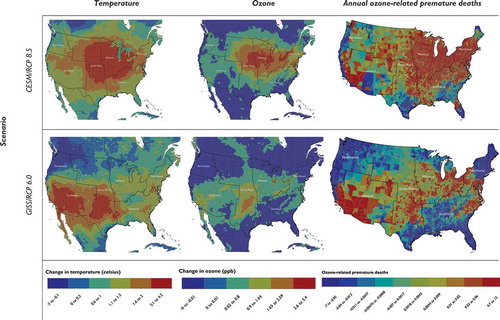
Table 1. Additional ozone-related premature deaths and illnesses attributable to climate change in 2030 in the continental United States (95% confidence intervals)
Table 2. Economic value of ozone-related premature deaths and illnesses attributable to climate change in 2030 (95% confidence intervals, millions of 2010 dollars)
Table 3. Estimated number of additional ozone-related premature deaths and illnesses attributable to projected change in the U.S. climate (95% confidence intervals)
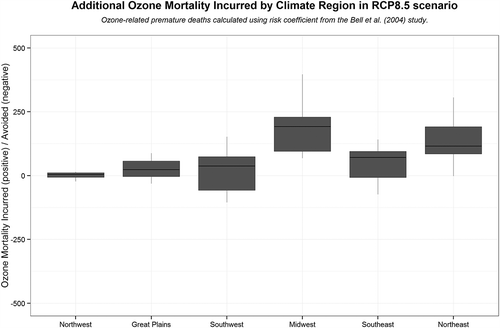
Figure 3. Annual number of climate-attributable ozone-related premature deaths by region and year for the CESM/RCP 8.5 scenario.