Figures & data
Table 1. Standard of each pollutant for calculating individual air quality (Ii)
Figure 1. Air quality of Beijing in January 2013 with space views of nonpolluted (2013.01.03) and polluted (2013.01.12) days.
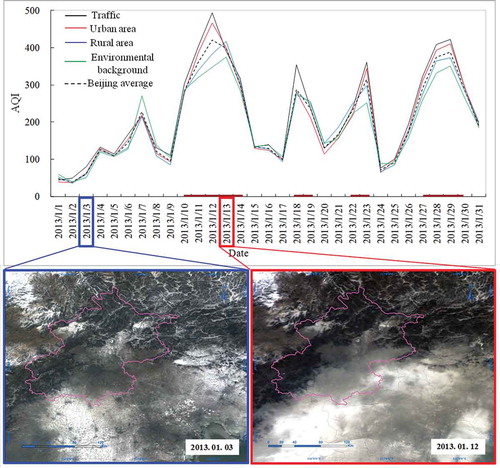
Figure 2. Linkage of visibility with wind speed and AQI.
Figure 3. Air quality index (AQI) and primary pollutant of Beijing in January 2013.
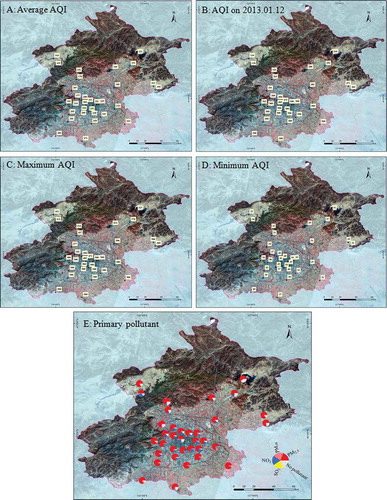
Figure 4. Frequency of wind direction with maximum and extreme wind speed at Beijing in January 2013.
Figure 5. Relation between fraction of impervious surface and air quality index (AQI) within the 6th Ring Road of Beijing during the severe polluted days (AQI > 300).