Figures & data
Figure 1. Locations of 23 meteorological stations. Black dots (●) are seven metropolitan cities: 1, Seoul, the capital of Korea; 2, Incheon; 3, Daejeon; 4, Daegu; 5, Ulsan; 6, Gwangju; and 7, Busan. Stars (⛆) represent other nonurban sites.
Table 1. Classification of precipitation intensity (PI) in this study
Figure 2. Time series of annual mean visibilities observed seven major cities and nonurban cities.
Figure 3. Spatial distributions of visibility. Kriging method was used as an objective analysis to produce spatial distributions from measurements obtained at 23 sites illustrated in .
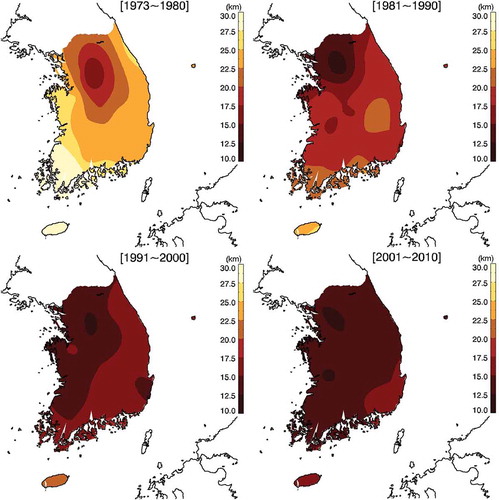
Figure 4. Time variations of sunshine duration with the regression lines over the analysis period. Short-term regression lines (thick blue line) starting in 1990 are shown for individual seven major cities.
Figure 5. Spatial distributions of sunshine duration. Kriging objective analysis was used to produce spatial distributions from measurements obtained at 23 sites illustrated in .
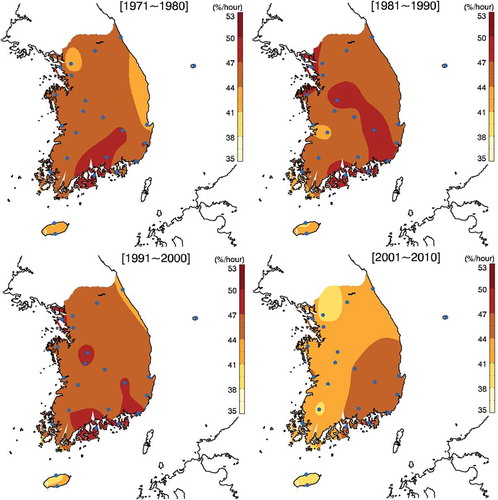
Figure 6. Time variations of occurrences of precipitation intensities (PI) observed over 1970–2010.
Figure 7. Time variations of occurrences of precipitation intensities (PI) averaged for 23 sites for the period of (left panel) and after 1990 (right panel). Black dots (●) indicate mean, and error bars plus and minus one standard deviation.
Figure 8. Time series of seven cloud types divided into 10 type classifications of WMO for the period of 1970–2010. Black dots (●) indicate mean, and error bars plus and minus one standard deviation.
Figure 9. Time series of cloud cover fractions divided to 11 categories for the period of 1970–2010. Black dots (●) indicate mean, and error bars plus and minus one standard deviation.