
Figures & data
Table 1. Definitions of variables and parameters
Figure 1. The Beijing–Tianjin–Hebei region of China.
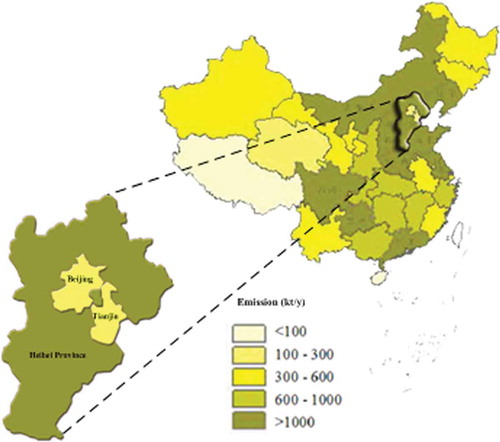
Table 2. Data for the years 2003–2009
Table 3. A comparison of SO2 reductions between cooperative and noncooperative models for 2009
Figure 2. SO2 pollution reduction quantities for each province (expressed as percentage of the total regional pollutant reduction quantity) under the NCRM and the CRM approaches in 2009.
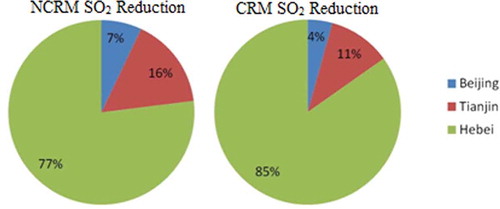
Table 4. The calculation of benefit allocation to Beijing in 2009
Table 5. Pollution reduction benefit allocation (K USD)
Table 6. Pollution reduction cost saving in CRM in 2003–2009 (K USD)
Table 7. The sensitivity result for CRM (K USD)