Figures & data
Table 1. Example of an uncertainty budget for predicted emissions measurements of CO2
Table 2. Example of an uncertainty budget for direct emissions measurements of CO2 in the exhaust duct of the LFRL
Figure 1. Photograph of the natural gas burner operating at a heat release of 8 MW. The 1.2-m-wide nonpremixed tube burner can deliver controlled fires from 0.1 to 8 MW.
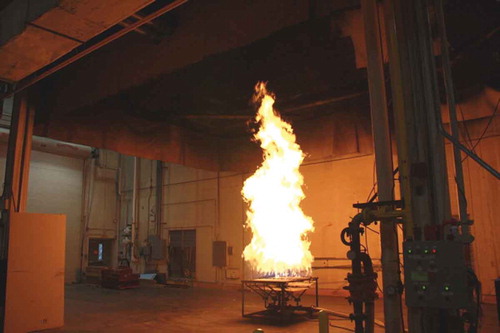
Figure 2. Photograph of the natural gas fuel delivery system used to control and measure the mass flow rate and composition of the fuel that supplies the burner.
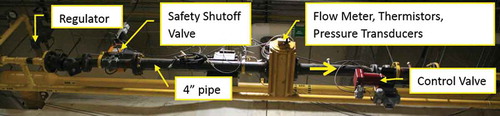
Figure 3. Direct emissions measurements were made in the exhaust duct that ran along the roof of the Large Fire Research Laboratory.
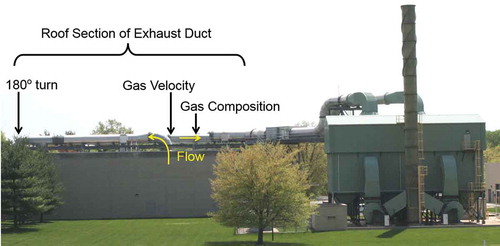
Figure 4. Schematic of the measurement section of the 1.5-m exhaust duct. Bulk flow was computed from a series of point velocity measurements made by traversing S probes across the duct. Gas samples flowed continuously from the sampling tee to the gas analyzers.
Figure 5. Illustration of the CO2 mass balance as applied for the present study. The direct emissions measurements in the exhaust duct are validated by the predicted emissions measurements conducted prior to the exhaust duct.
Figure 6. The predicted emissions measurements, CO2 output of the burner, were repeatable to within ±1.0% (shown by dashed lines).
Figure 7. Relative difference between direct and predicted emissions measurements of CO2 for natural gas fires. Error bars represent the expanded uncertainty estimates for the direct emissions measurements, approximately ±4%. The average relative difference is shown as the dashed gray line.
Figure 8. Relative difference between direct and predicted emissions measurements of CO2 for the case of direct emissions derived from measurements of O2 volume fraction. Error bars represent the expanded uncertainty estimates for the direct emissions measurements, approximately ±7%. The average relative difference is shown as the gray dashed-dotted line, whereas the average from the CO2 measurements, black dashed line, is shown for reference.
Figure 9. Data quality check of exhaust duct gas sampling measurements (direct) and fuel supply gas composition measurements (predicted). Fuel Factors computed from measurements are compared with the default value for natural gas.