Figures & data
Table 1. PM2.5 concentrations and duration of exposure during prescribed burning events
Figure 1. Yarra Valley (Warburton and Yarra Junction): daily concentrations of PM2.5 during prescribed burning event (2013).
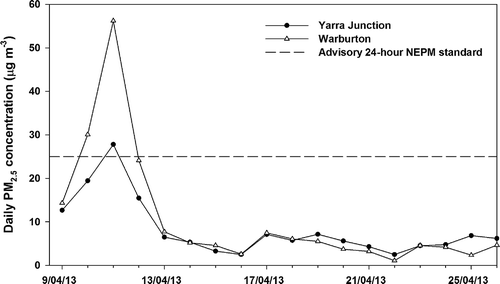
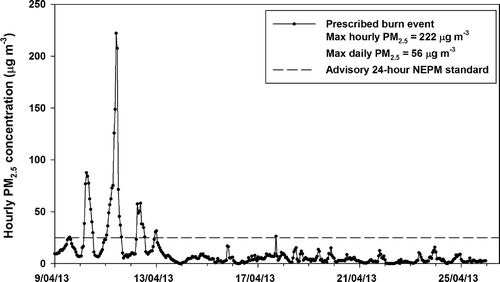
Figure 2. Yarra Valley (Warburton): hourly concentrations of PM2.5 during prescribed burning event (2013).