Figures & data
Figure 1. Annual mean PM2.5 concentration averaged (a) from 2002 to 2004 (top column, 2000s) and (b) from 2057 to 2059 (middle column, 2050s). (c) Difference of annual mean PM2.5 concentration between the future year and the present year (bottom column, 2050s–2000s).
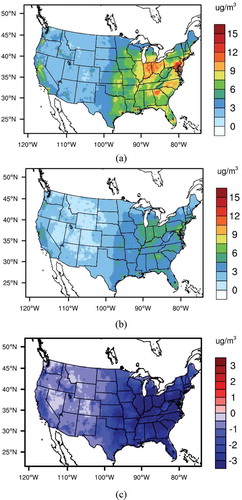
Figure 2. Annual mean MDA8 ozone concentration averaged (a) from 2002 to 2004 (top column, 2000s) and (b) from 2057 to 2059 (middle column, 2050s). (c) Difference of annual mean MDA8 ozone concentration between the future year and the present year (bottom column, 2050s – 2000s).
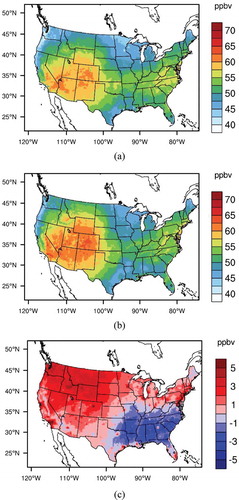
Table 1. PM2.5- and ozone-related mortality source in the “EPA Standard Health Functions” data set of BenMAP-CE
Table 2. National PM2.5- and ozone-related mortality in the 2000s and 2050s with baseline incidence rate and population held constant (rounded to the nearest 100)
Table 3. Evaluation of model output for PM2.5 from 2001 to 2004 (mean fractional bias/mean fractional error [MFB/MFE], normalized mean bias/normalized mean error [NMB/NME], and mean normalized bias [MNB] and mean normalized error [MNE])
Figure 3. PM2.5-related all-cause (after pooling), ischemic heart disease and lung cancer mortality in (a) the 2000s and (b) the 2050s with population and baseline incidence rate held constant at 2000 level; (c) PM2.5-related all-cause (after pooling), ischemic heart disease, and lung cancer mortality in the 2050s with projected baseline incidence rate and population. The error bars represent the 95% confidence interval of each incidence for different states.
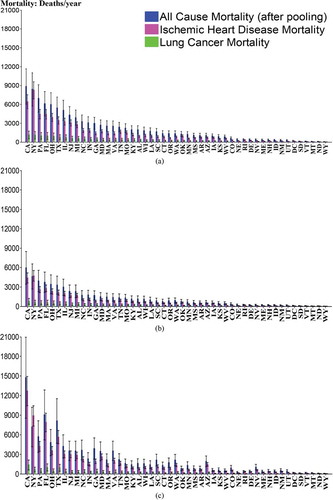
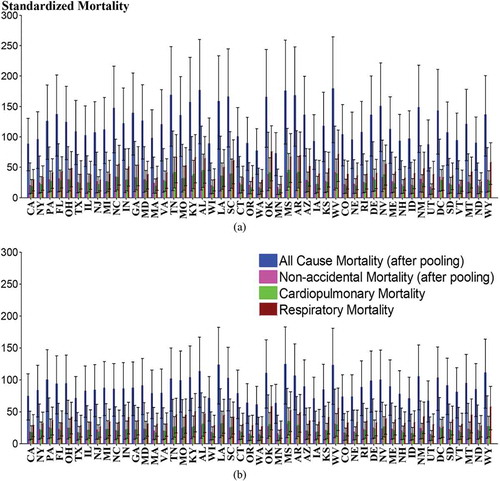
Figure 4. Ozone-related all-cause (after pooling), nonaccidental (after pooling), cardiopulmonary and respiratory premature mortality in (a) the 2000s and (b) the 2050s with population and baseline incidence rate held constant at 2000 level; (c) ozone-related all-cause (after pooling), nonaccidental (after pooling), cardiopulmonary and respiratory premature mortality in the 2050s with projected baseline incidence rate and population. The error bars represent the 95% confidence interval of each incidence for different states.
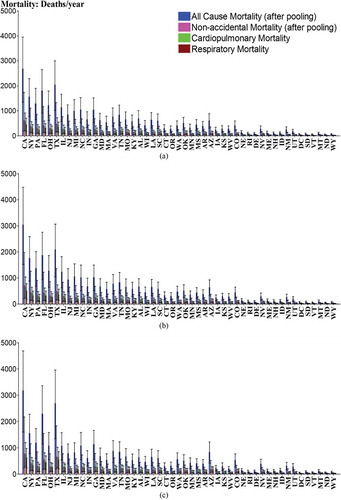
Table 4. National PM2.5- and ozone-related mortality in the 2050s with projected baseline incidence rate and population (rounded to the nearest 100)
Figure 5. Standardized PM2.5-related mortality estimates (a) in the 2000s and (b) in the 2050s (with projected population and baseline incidence rate).
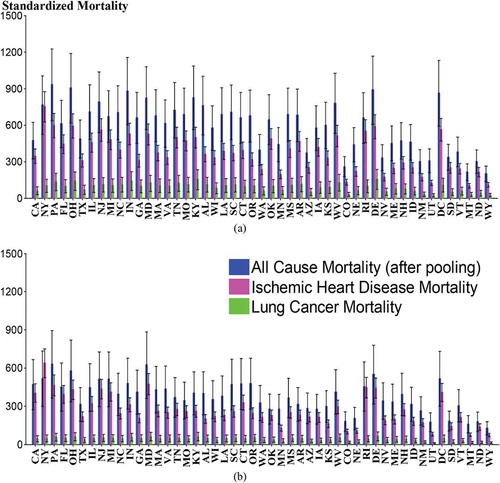
Figure 6. Standardized ozone-related mortality estimates (a) in the 2000s and (b) in the 2050s (with projected population and baseline incidence rate).