Figures & data
Figure 1. Map of the project region.
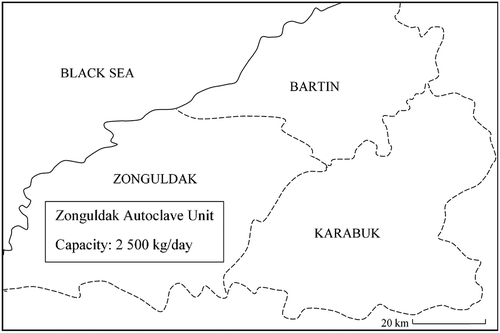
Figure 2. Regional decision tree.
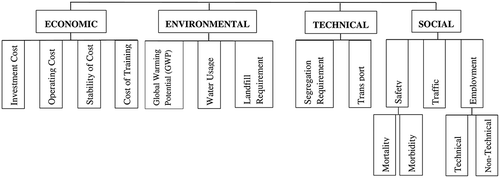
Figure 3. Schematic view of SC1.
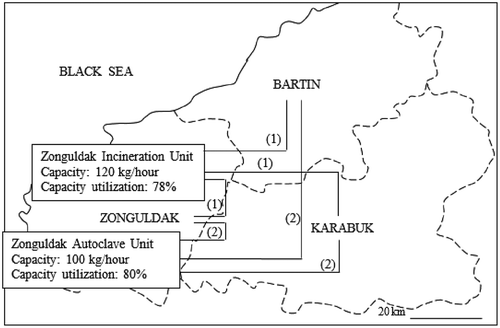
Figure 4. Schematic view of SC2.
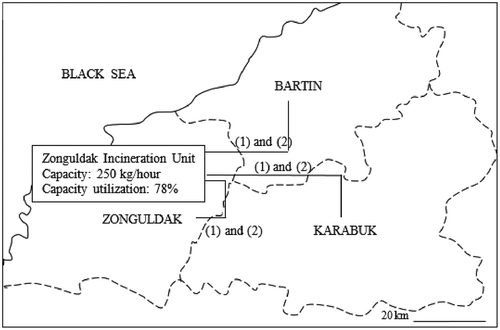
Figure 5. Schematic view of SC3.
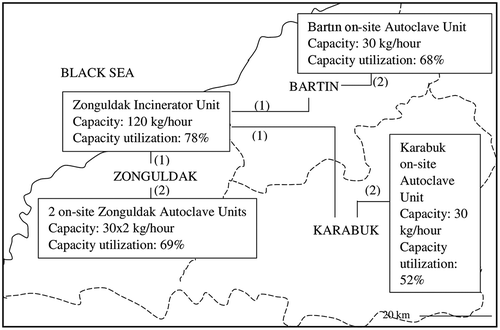
Table 1. Cost values of the scenarios
Table 2. GWP (CO2-e emissions) of the scenarios
Table 3. Relative weighting of “Environment”
Table 4. Relative weighting of “Technical”
Table 5. Relative weighting of “Social”
Table 6. Relative weighting of “Economic”
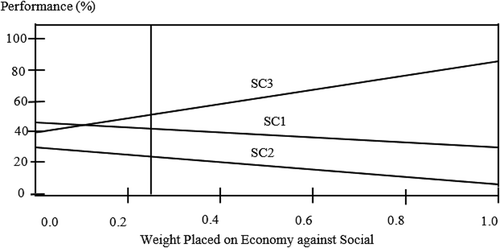
Figure 6. Frontier analysis of economic-social decision model.
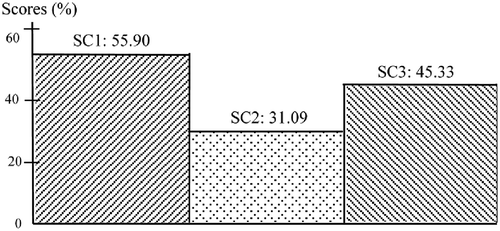
Figure 7. Sensitivity graph of “Economy.”
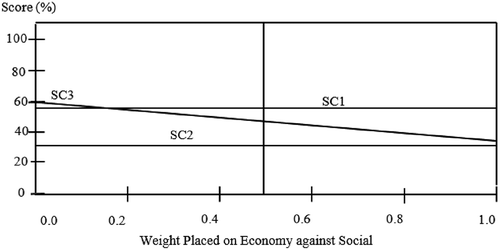
Figure 8. Sensitivity graph of “Economy.”
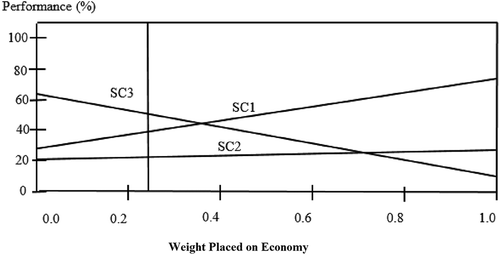
Figure 9. Sensitivity graph of “Environment.”
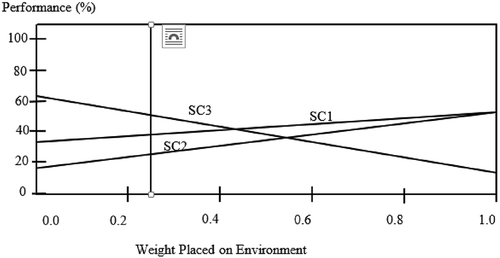
Figure 10. Sensitivity graph of “Technical.”
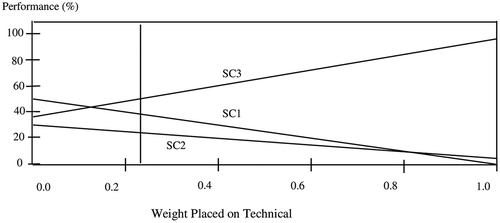
Figure 11. Sensitivity graph of “Social.”