Figures & data
Figure 1. Changes in the exhaust of on-highway heavy-duty diesel engine technology between 1998 and 2010.
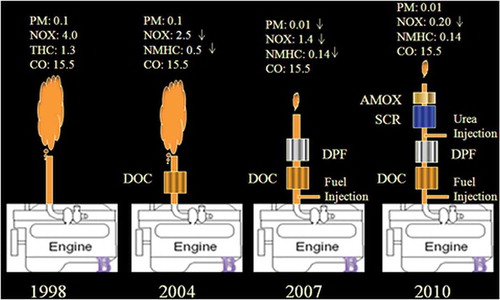
Table 1. ULSD fuel properties used in the ACES Phase 2 program
Table 2. Average lube oil properties for fresh oil and after 125 hr of engine operation (ACES Phase 2)
Figure 2. Experimental setup for engine and sampling system.
Table 3. Cycle used for each engine test and the number of repeats for regulated and unregulated species
Table 4. Average regulated emissions summary for three FTP composite cycles (1/7 × cold-start + 6/7 × hot-start), one per 2010 engine
Table 5. Regulated emissions comparison for FtP composite between 2010- and 2007-technology engines
Table 6. Greenhouse gas species, other gases and regulated (16-hr cycle)
Table 7. Summary of average unregulated emissions for 9 and 12 repeats of the 16-hour cycles for 2010 and 2007 ACES engines, and for 2004-technology engines used in CRC E55/E59 (with dioxins compared to 1998 levels)
Table 8. CARB toxic air contaminant average emissions for all 12 repeats of the 16-hr cycles for all four 2007 ACES engines and all three 2010 engines, and for 1994 to 2000 technology engines running over the FTP transient cycle
Table 9. PAH and nitro-PAH average emissions for all 12 repeats of the 16-hr cycles for all four 2007 ACES engines and all three 2010 engines, and for 2000-technology engine running over the FTP transient cycle
Table 10. Elemental average emissions for 2010 (9 repeats) and 2007 technology engines (12 repeats) for 16-hr cycle, and for 1994 to 2000 technology engines running over the FTP transient cycle
Table 11. Additional elements for comparison between 2010- and 2007-technology engines (16-hr cycle)
Figure 3. Emissions of inorganic ions (16-hr cycle).
Figure 4. Particulate matter emissions and composition (16-hr cycle, 2007- and 2010-technology engines).
Figure 5. Particulate matter composition (16-hr cycle, 2007- and 2010-technology engines). (Right figure made smaller to reflect lower PM emissions but was not scaled down by 62%.)
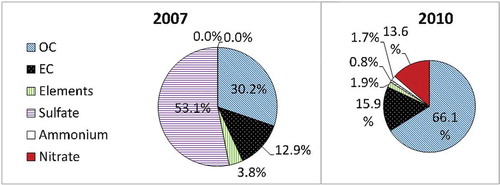
Figure 6. Particle number emissions for hot-start FTP transient cycle.
Figure 7. Particle number emissions for the 16-hr cycle.
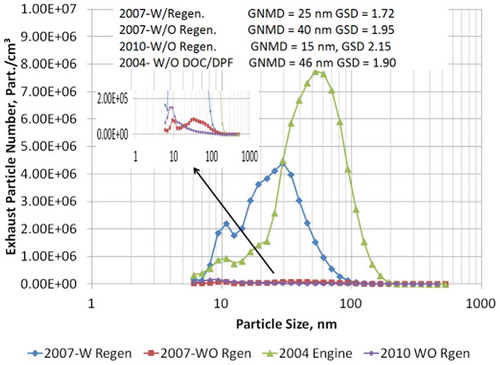
Figure 8. Particle number-weighted size distribution for different technology engines (W & WO: with and without active DPF regeneration; GNMD: geometric number mean diameter; GSD: geometric standard deviation).