Figures & data
Table 1. Instruments list in Chongming site.
Table 2. September 2009 to April 2012 TGM concentration in three sampling periods (ng m−3).
Table 3. Summary of field observations of TGM.
Table 4. Seasonal TGM concentration in Chongming (ng m−3).
Table 5. Monthly TGM concentration in Chongming (ng m−3).
Figure 1. The sampling procedure.
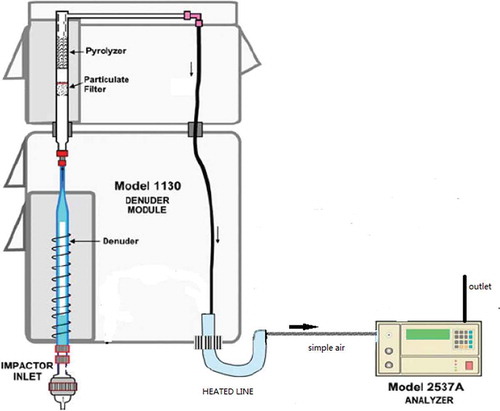
Figure 2. TGM diurnal variation in the different seasons in Chongming Island.
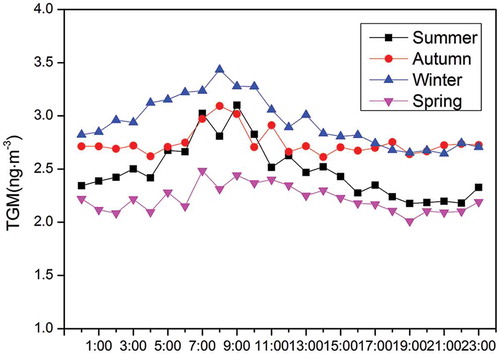
Figure 3. Weather conditions: temperature.
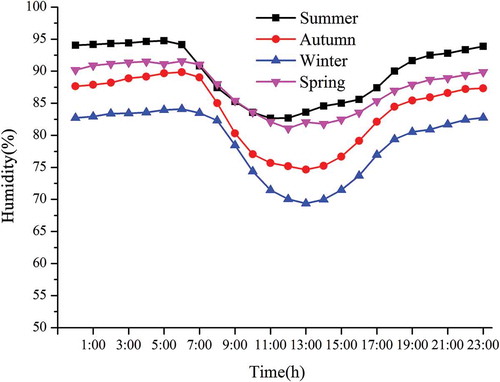
Figure 4. Weather conditions: relative humidity.
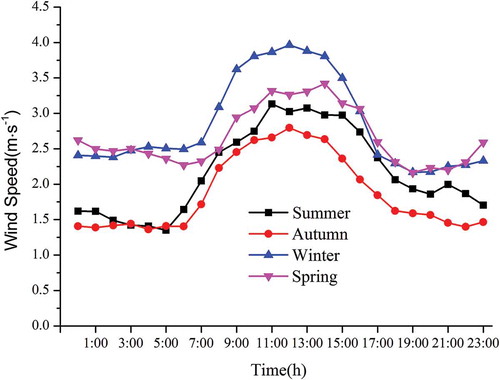
Figure 5. Weather conditions including wind speed.
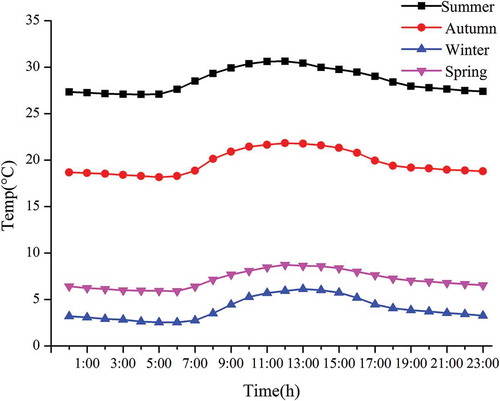
Figure 6. Weather conditions: solar radiation.
Figure 7. The TGM circadian variation in different seasons.
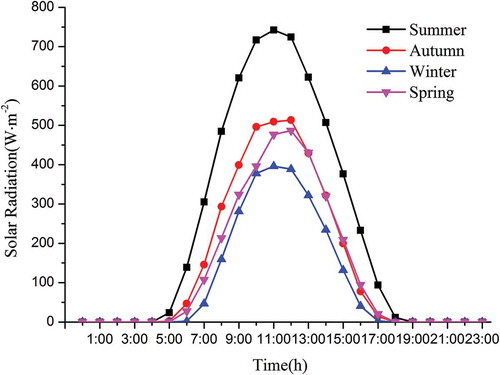
Figure 8. The relative frequency of wind direction.
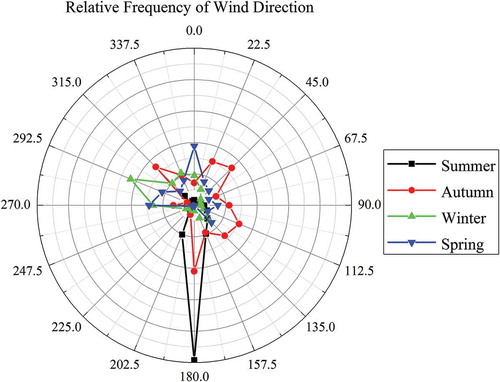
Figure 9. The TGM frequency distribution.
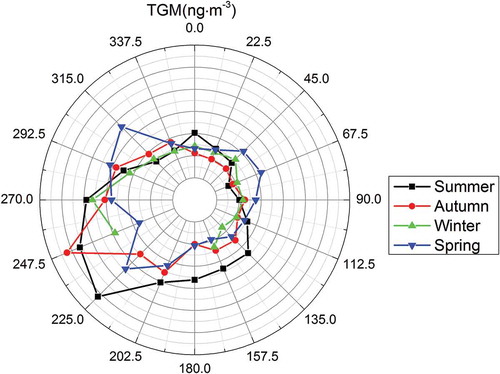
Table 6. TGM average concentration under different wind speeds (2009/9/17–2009/12/17, 2010/7/14–2011/2/8, 2011/11/28–2012/3/25).
Figure 10. The 2010/9/12–9/20 comparison between TGM and wind speed (Wspd).
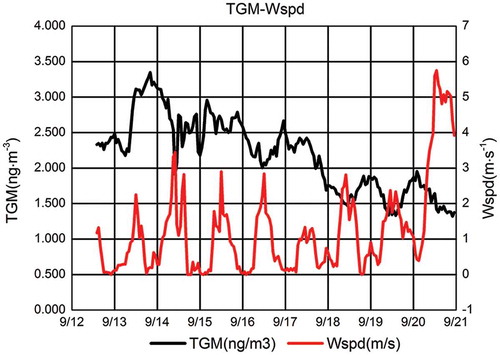
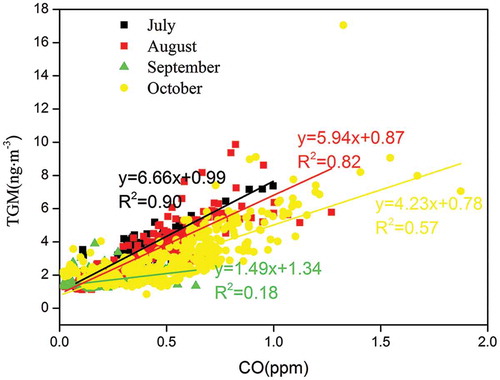
Figure 11. TGM and CO relationship.