Figures & data
Figure 1. Monitoring site location.
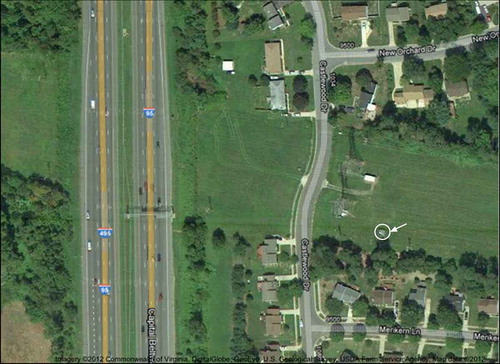
Figure 2. Monitoring site location relative to the comparison monitoring sites.
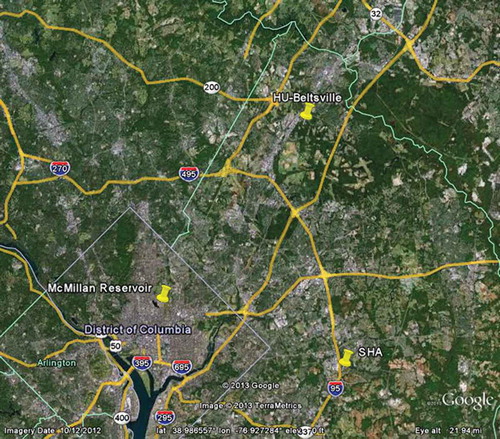
Table 1. Concentrations (μg/m3) by year
Figure 3. Daily PM2.5 concentrations in the first quarter of 2012 (E-BAM and Super SASS at SHA site and continuous monitors at HU-Beltsville and McMillan sites).
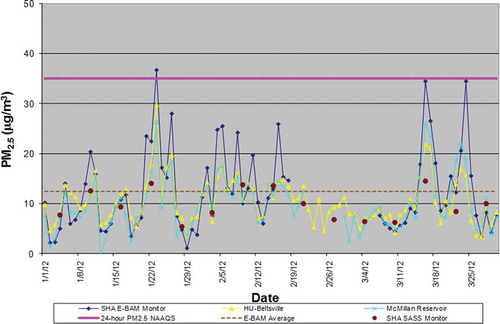
Figure 4. Speciation results—major monitored elements.
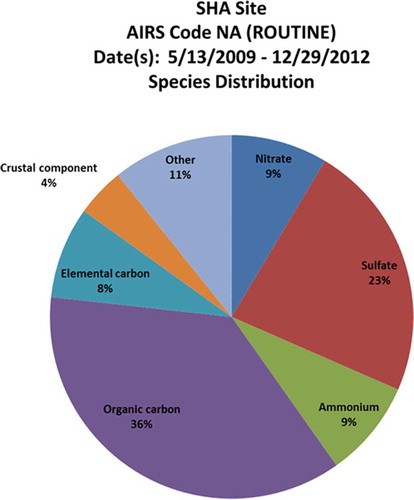
Figure 5. Speed and direction observed at the SHA monitoring site (2009–2012).
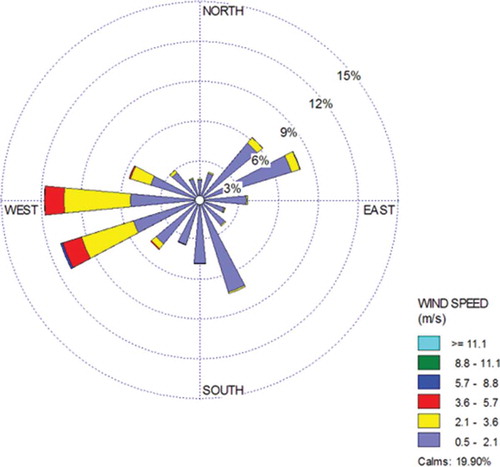
Figure 6. Hourly PM2.5 concentrations and traffic volumes.
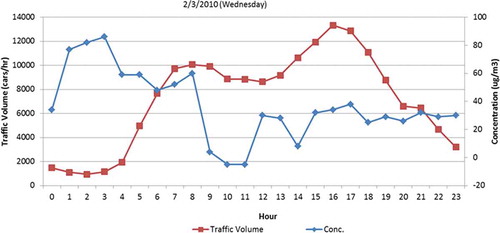
Figure 7. Hourly PM2.5 concentrations and HDT traffic volumes.
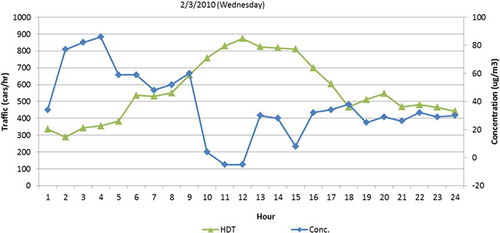
Table 2. 24-Hour PM2.5 concentrations (μg/m3) measured at continuous monitors
Figure 8. Diurnal variation of the ambient air temperature and monitored PM2.5 concentrations during the summer season.
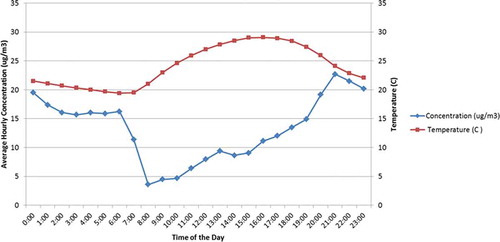
Figure 9. Diurnal variation of the ambient air temperature and monitored PM2.5 concentrations during the winter season.
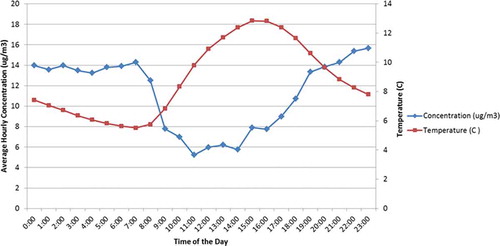
Figure 10. Average hourly traffic volumes and monitored PM2.5 concentrations.
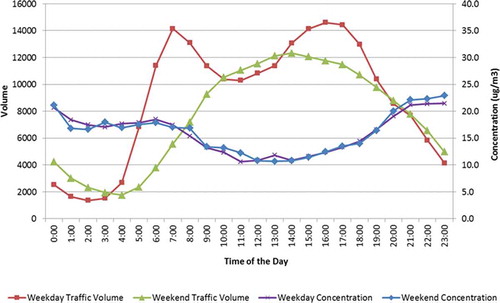
Figure 11. Average hourly heavy-duty vehicle volumes and monitored PM2.5 concentrations.
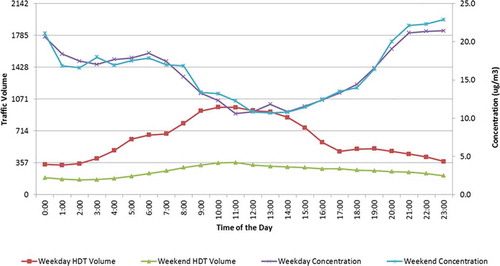
Figure 12. Comparison of species distribution between SHA, McMillan, and HU-Beltsville sites.
Table 3. Annual source apportionment of PM2.5 mass concentrations
Figure 13. PM2.5 apportionments at SHA site in 2009 by month.
Figure 14. PM2.5 apportionments at SHA site in 2010 by month.
Figure 15. PM2.5 apportionments at SHA site in 2011 by month.
Figure 16. PM2.5 apportionments at SHA site in 2012 by month.