Figures & data
Table 1. Industrial areas targeted for DIAL measurements of alkane VOC and benzene emissions and their descriptions.
Table 2. Summary statistics of measured benzene emissions by emission location (lb/hr).
Figure 1. Wastewater 1 unit: (a) Contour plot of DIAL concentration profile. (b) Visualization of the flux measurement.
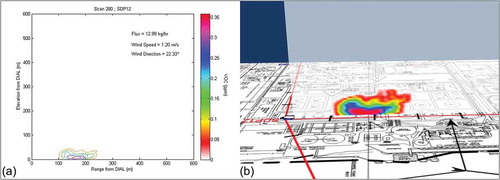
Figure 2. Tanks Set 4: (a) Contour plot of DIAL concentration profile. (b) Visualization of the flux measurement.
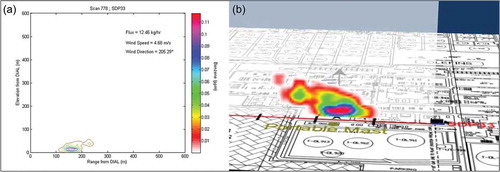
Table 3. Summary statistics of measured alkane VOC emissions by emission location (lb/hr).
Table 4. Comparison of benzene emission factor emission estimate and measured emissions of by emission location (lb/hr).
Figure 3. Distribution of measured benzene emissions in relation to emission factor estimate (lb/hr).
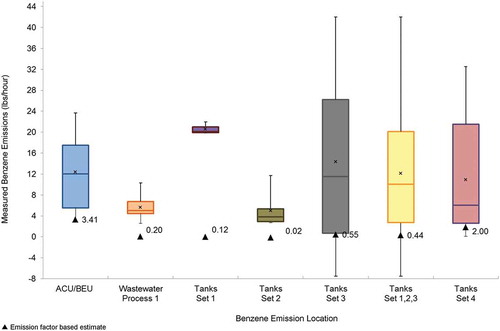
Table 5. Comparison of alkane VOC emission factor emission estimate and measured emissions of by emission location (lb/hr).
Figure 4. Distribution of measured VOC emissions in relation to emission factor estimate (lb/hr).
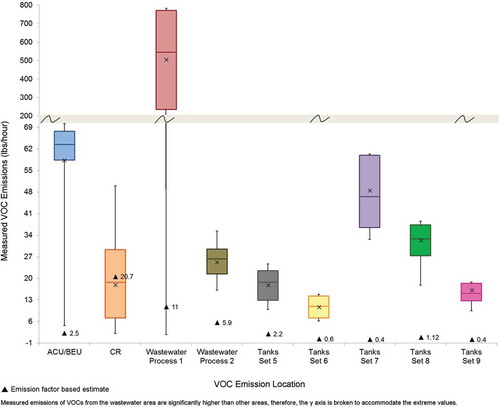
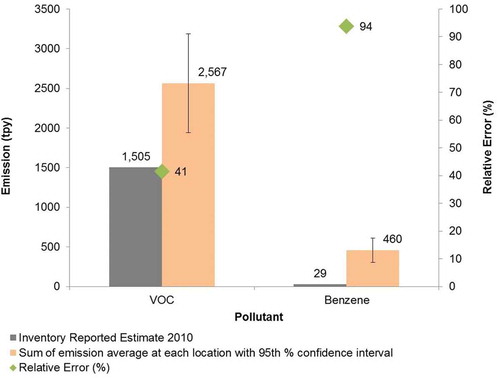
Figure 5. VOC and benzene emissions: underestimation and relative error, magnitude of measured emissions, and revision prioritization.
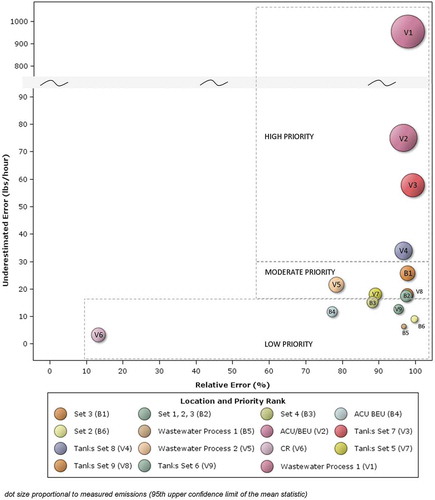
Figure 6. Measured vs. emission inventory reported site emissions.