Figures & data
Table 1. WRF-ARW dynamic and physical options used in this study.
Table 2. CMAQ dynamic, physical, and chemical options used in this study.
Figure 1. Prediction cycles and assimilation diagram.
Table 3. OI-related settings in this study.
Table 4. Hourly statistical results over CONUS from 12Z, 07/06/2011 to 12Z, 07/07/2011: Correlation coefficients and mean biases (MB).
Figure 2. Dynamic relative uncertainties for AIRNow OI used in OI4 case at 17 UTC: (a) aerosol and (b) ozone.
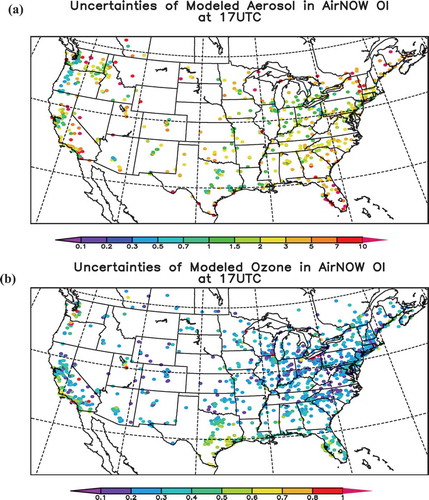
Figure 3. Predicted and OI-assimilated surface accumulation-mode sulfate at 17Z, 07/02/2011: (a) the first-guess model (14Z OI4 run), (b) OI4 AIRNow OI only, and (c) OI4 AIRNow+MODIS OI.
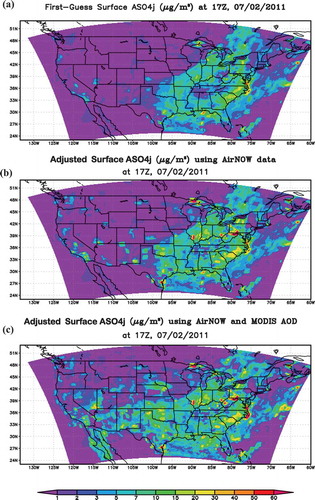
Figure 4. Cross-section plot over 39°N of the accumulation-mode sulfate differences: (a) after AIRNow only OI, and (b) after AIRNow+MODIS OI (OI4 run).
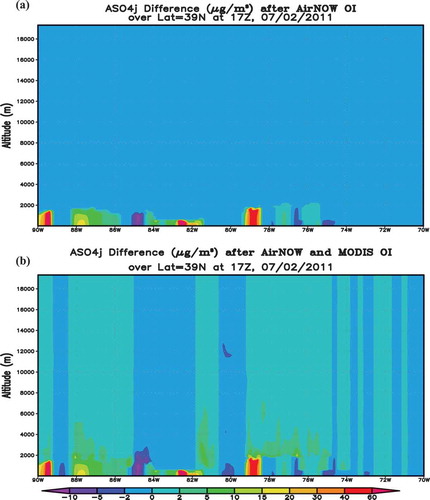
Figure 5. Predicted surface PM2.5 and its bias compared to AIRNow measurements in the base case (a) and OI4 (b) over the northeastern United States. The corner color bars show the predicted PM2.5, and the bottom color bars show the biases.
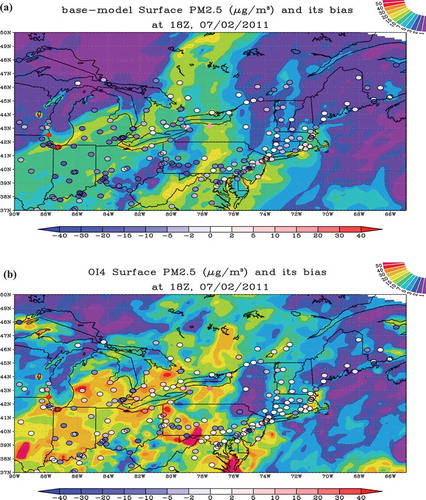
Figure 6. CMAQ base model and 4 OI runs compared to AIRNow surface PM2.5 over continental United States (a) and ozone over northeastern United States (b) (north of 37°N, east of 90°W).
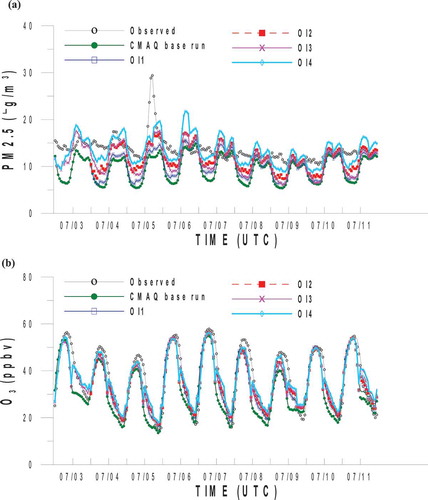
Table 5. Same statistics but for southeastern states (FL, GA, AL, MS, TN, SC, NC, VA, WV) from 12Z, 07/06/2011, to 12Z, 07/07/2011.
Figure 7. Discover-AQ 2011 P-3B flight on July 20: (a) flight path and (b) model/observed ozone comparison.
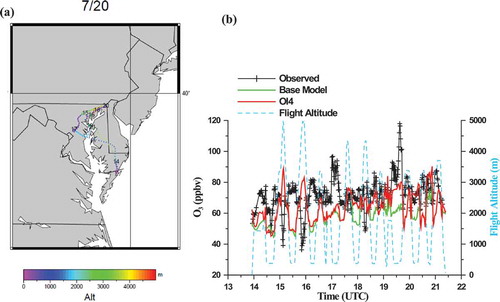
Figure 8. Discover-AQ P-3B flight on July 27: (a) flight path and (b) model/observed ozone comparison.
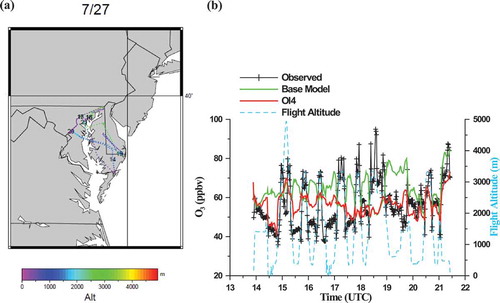
Figure 9. The base model (“o” symbol and solid fit line) and OI4 (“+” symbol and dash fit line) O3 versus observation for 13 Discover-AQ P-3B flights (07/02/2011–07/29/2011) below 2 km.