Figures & data
Table 1. Factors and levels in Box-Behnken design (BBD) of experiment.
Figure 1. Effects of (a) irradiation time, (b) impregnation time, and (c) mass ratio of alkali-to-char on the iodine adsorption value.
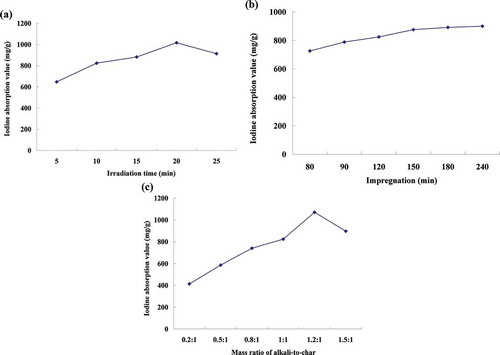
Table 2. Experimental design and results for response surface methodology (RSM).
Table 3. Analysis of variance for the regression equation.
Figure 2. Response surface polts showing the effects of variables (X1 = irradiation time, min; X2 = impregnation time, min; and X3 = the mass ratio of alkali-to-char) on the iodine adsorption value.
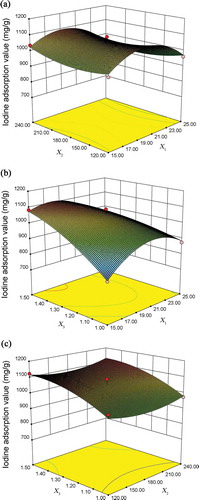
Figure 3. Adsorption isotherms of CBAC prepared under optimal conditions.
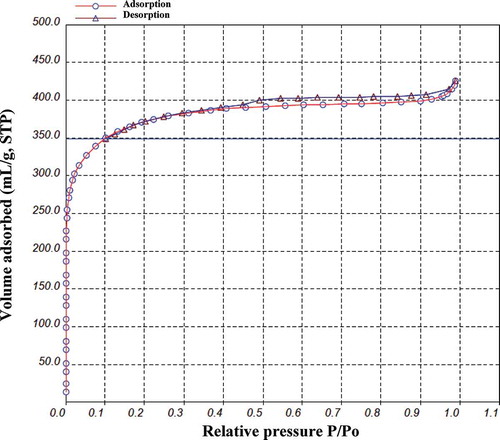
Table 4. Comparisons of activated carbons for the characterization of the microstructure.
Figure 4. HK-pore size distribution of CBAC prepared under optimal conditions.
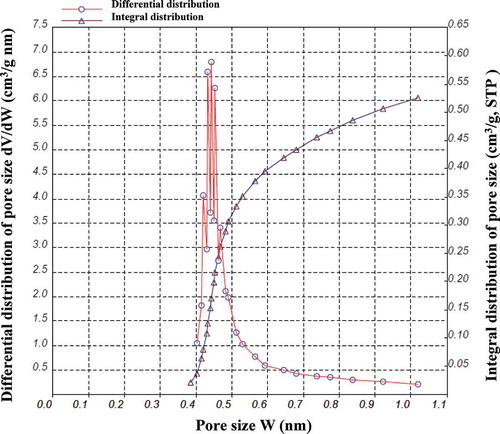
Figure 5. SEM micrographs of (a) char (2000×) and (b) CBAC (2000×).
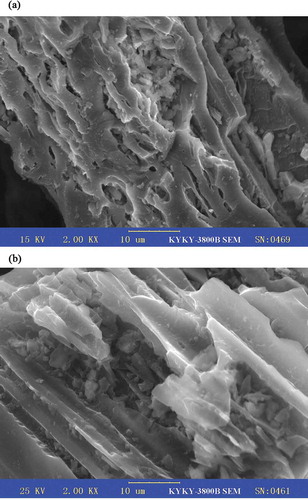
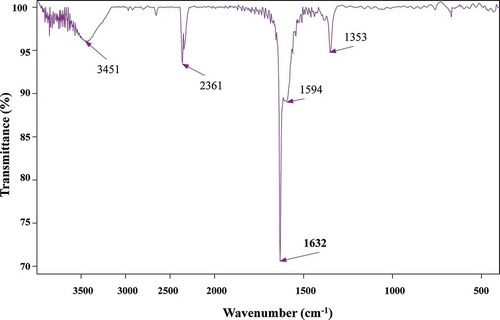
Figure 6. FTIR spectrum of CBAC.