Figures & data
Figure 1. Range of air toxics concentrations measured in Canada by NAPS from 2009 to 2013. Nondetectable concentrations have been replaced by average analytical detection limits in this figure only.
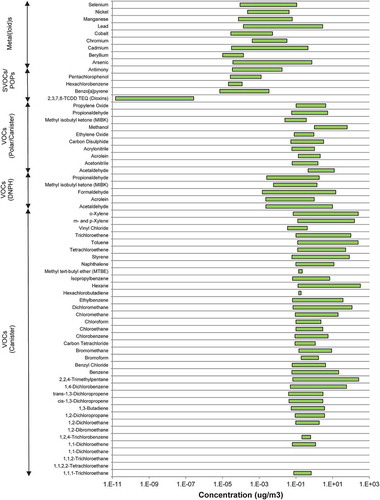
Figure 2. Detection limits and detectability for air toxics in Canada measured by NAPS from 2009 to 2013. Detection limit for 2,3,7,8-TCDD is the range of values for the 29 dioxin, furan, and dioxin-like PCB congeners. Detection limits for metals and metalloids are the range of reported values over the study period. Detectability bars represent site-specific minimum, all-site average, and site-specific maximum values.
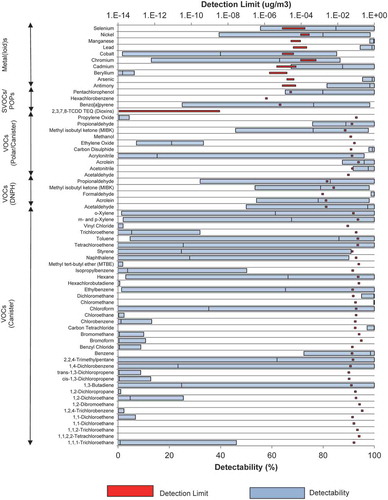
Figure 3. Average and maximum benzene concentrations measured by NAPS from 2009 to 2013. Population data taken from the 2011 Census (Statistics Canada (Citation2013, Citation2015).
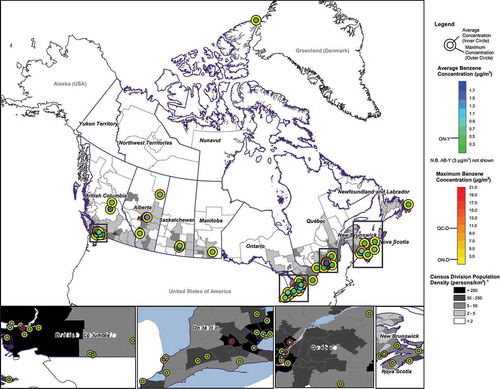
Figure 4. Average and maximum benzo[a]pyrene concentrations measured by NAPS from 2009 to 2013. Population data taken from the 2011 Census (Statistics Canada, Citation2013, Citation2015).
![Figure 4. Average and maximum benzo[a]pyrene concentrations measured by NAPS from 2009 to 2013. Population data taken from the 2011 Census (Statistics Canada, Citation2013, Citation2015).](/cms/asset/9dad6b52-9b97-43a7-9900-f9ef51908afb/uawm_a_1096863_f0004_oc.jpg)
Figure 5. Average and maximum ethylene oxide concentrations measured by NAPS from 2009 to 2013. Population data taken from the 2011 Census (Statistics Canada, Citation2013, Citation2015).
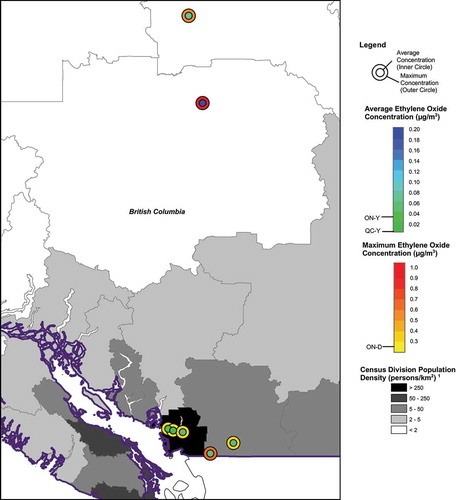
Figure 6. Acrolein concentrations measured at Port Moody BC (100111) using canister and DNPH sampling.
Figure 7. Air toxics that approached but did not exceed annual or 24-hr guidelines during the study period.