Figures & data
Figure 1. Total number of coal-fired EGUs, and the number and percent with installed SCR in each year in CAIR states.
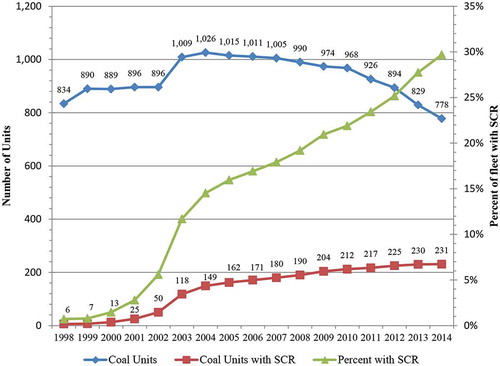
Figure 2. CAIR states average ozone season NOx emission rates of SCR-equipped coal-fired EGUs, with number of units.
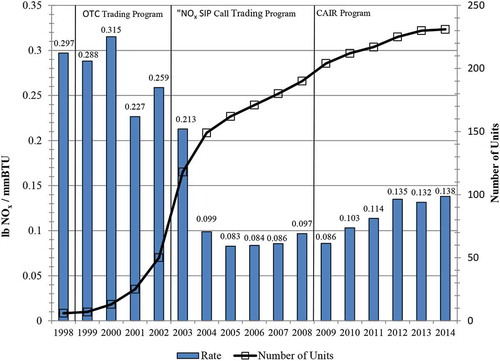
Figure 3. Average ozone season emission rates of coal-fired, SCR-equipped EGUs among the Top 200 NOx emitters in each of the three cap and trade programs.
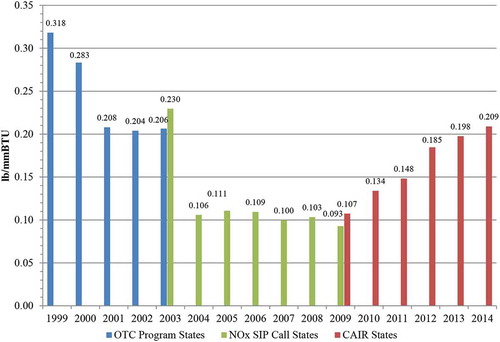
Table 1. Representative individual EGU comparisons of pre-SCR installation NOx emission rates (lb NOx/mmBTU), with BORs, 2014 ozone season rates, and 2014/BOR ratios.
Figure 4. Numbers of SCR Coal units found among the top cohorts of CAIR states NOx-emitting EGUs in the 2008–2014 ozone seasons.
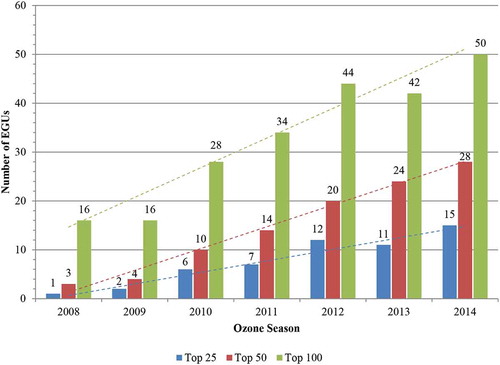
Table 2. Percentage of U.S. annual electric generation by fuel type.
Figure 5. Production of shale gas and annual average delivered gas cost for electrical generation, 2007–2013.
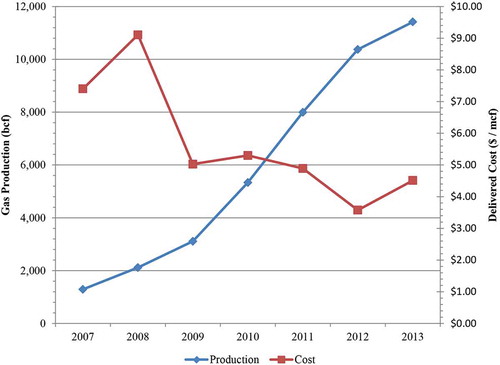
Figure 6. Total monthly average ozone season allowance costs at 3.0 lb NOx/MWhr, with monthly average natural gas electrical generation costs, approximate ammonia cost, and average ozone season emission rates.
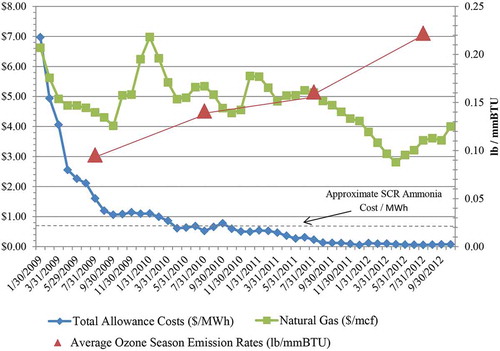
Figure 7. U.S. net electric generation.
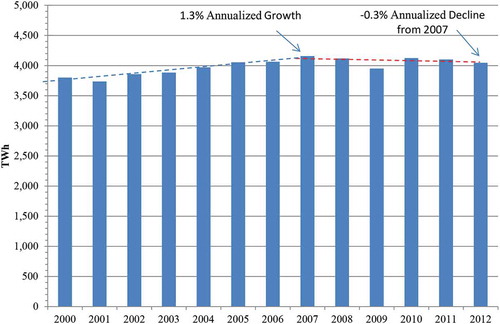
Figure 8. Average 2014 ozone season statewide NOx emission rates of SCR Coal EGUs.
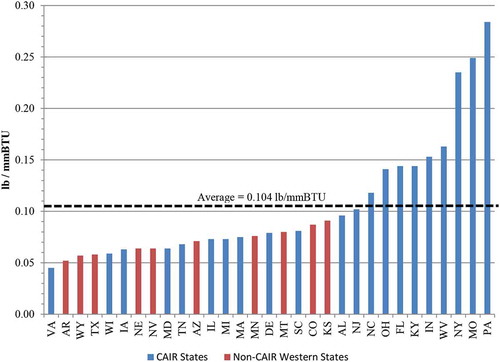
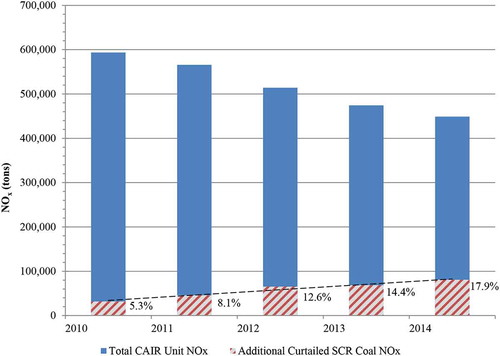
Figure 9. Ozone season NOx emissions in CAIR states with fraction due to SCR Coal curtailment and its percentage of total emissions.