Figures & data
Figure 1. Three flares used in the experiment: (a) QFS steam-assisted flare; (b) AFDS air-assisted flare; and (c) MPGF multipoint sonic flare.
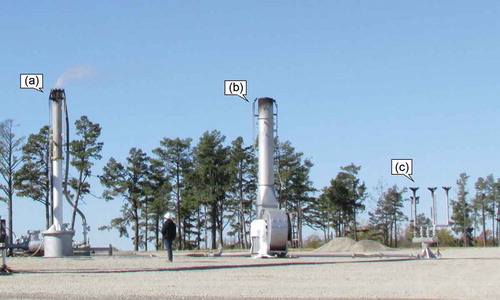
Figure 2. Experiment setup. (a) SOC750 hyper-spectral imager; (b) extractive sampling apparatus; and (c) gas monitoring trailer.
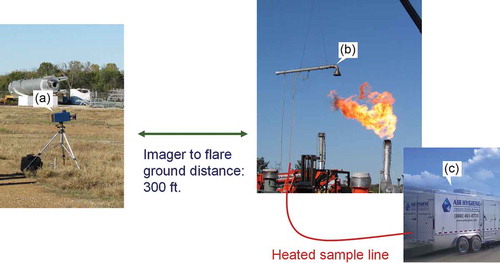
Table 1. Flare test conditions.
Figure 3. Example O2, CO2, and CE data from extractive method overlaid with imager test time for test numbers 36, 37, 38, and 39.
Table 2. Flare CE validation test results.
Figure 4. Flare CE measured by extractive method and by new method in 28 validation test runs.
Table 3. Repeatability - duplicated tests.
Figure 5. Examples of smoke level and smoke index: (a) test 29, smoke index = 0.56; (b) test 18, smoke index = 2.24; (c) test 14, smoke index = 7.41; and (d) test 16, smoke index = 8.89.
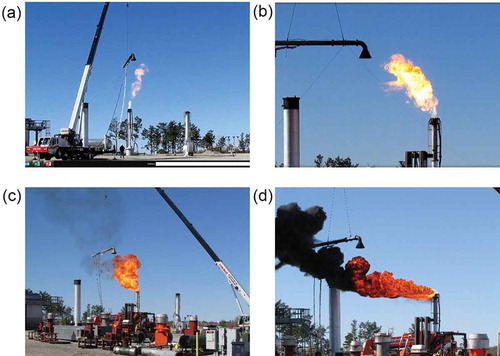
Table 4. Flare CE tests with smoke conditions.
Table 5. Flare CE tests at very low fuel rates and small flame sizes.
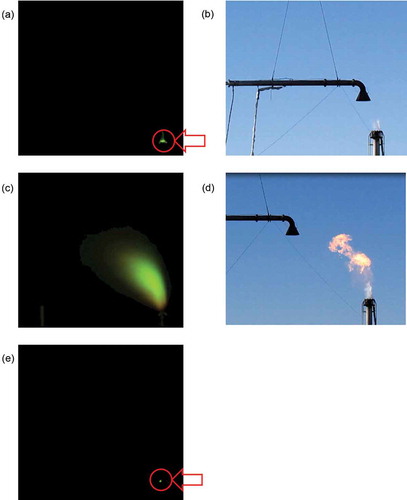
Figure 6. Images of small flare sizes and pilot: (a) IR image of Test 19; (b) visible image of test 19; (c) IR image of test 18; (d) visible image of test 18; and (e) IR image of test 13—no vent gas, lit pilot only.