Figures & data
Figure 1. An overview of pollutant concentrations and environmental variables at Yanbu based on 6 yr of observations. In these graphs, the box shows the range of the middle 50% of the data, the median is at the line at the notch, the mean is the line in the box, and the whiskers are the 95% limits. These are calculated for the 24-hr average concentrations utilizing all available data. Criteria pollutants are shown in (a) NO and NO2, (b) ozone, (c) SO2, (d) PM2.5 and PM10, and (e) VOCs. Major environmental factors that affect air quality are shown in (f) temperature, (g) visibility, (h) cloud fraction, (i) wind direction, and (j) wind speed.
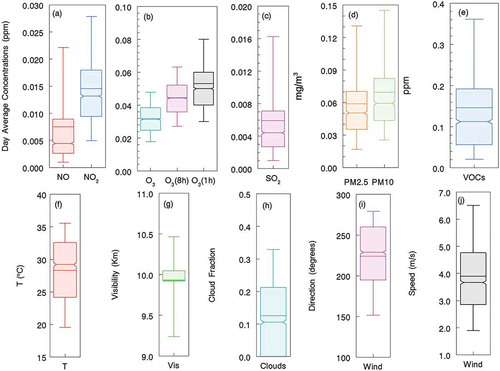
Figure 2. Factors affecting criteria pollutants at Yanbu. The difference of concentrations was calculated for conditions that lead to the highest 10% and the lowest 10% levels for the daytime averages of (a) O3, (b) PM2.5, and (c) SO2. Bars to the left show negatively correlated factors and to the right show the positively related ones; 90% confidence limits of the differences are shown as the error bars. Avg = 24-hr average concentrations; Max = 1-hr maximum; Day = Daytime and Night = Nighttime, both 12-hr averages.
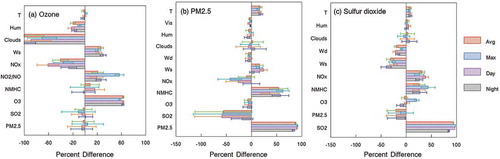
Figure 3. The relationship between VOCs, NOx, and O3 based on observed concentrations at Yanbu. (a) Daytime ozone decreases with increasing NOx especially when NOx exceeds about 20 ppb. (b) The relationship with VOCs is nonlinear for concentrations less than ~100 ppb; above that, ozone increases with increasing except when the VOC/NOx ratio is low. (c) Under various VOC conditions, the maximum ozone behaves differently from the daytime average ozone. Up to NOx levels of 20–30 ppb depending on the VOC regime, maximum hourly ozone increases with increasing NOx, but falls dramatically once that limit is exceeded. (d) VOCs have a similar effect on maximum ozone as the daytime average ozone, except that low-VOC conditions lead to lower ozone and the highest values of hourly maximum ozone occur when both NOx and VOCs are highest.
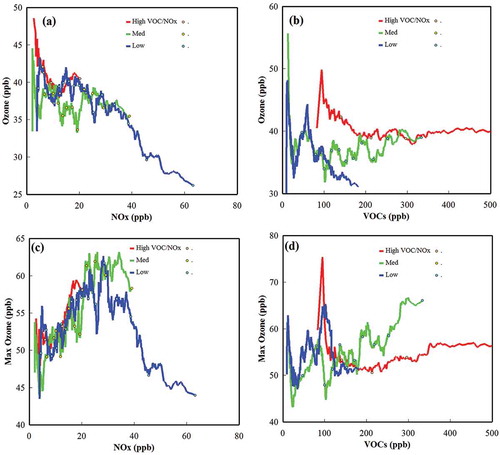
Figure 4. The effect of wind on the average hourly concentrations of the criteria pollutants and their precursors at Yanbu. (a) Average hourly wind speed in four categories (see text). In each wind category, we plot average hourly concentrations of fine particles (b) PM2.5, (c) PM10, (d) visibility (km), (e) SO2, (f) temperature, (g) VOCs, (h) NOx, and (i) ozone. The double peak of PM2.5 concentrations is seen as caused by two different phenomena. The morning peak corresponds to the traffic mix, and the afternoon peak comes from wind blown dust, since other pollutants are low at that time. For all species, SO2, VOCs, NOx, and also the PM2.5, the morning concentrations decrease with higher winds, as expected from the higher resulting dispersal rate.
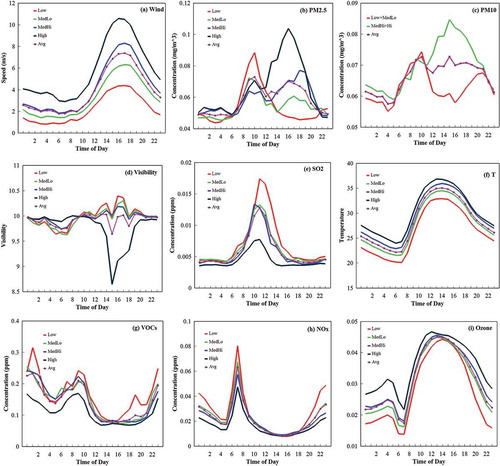
Figure 5. Average hourly levels of criteria pollutants at Yanbu. The data are averaged across the 6 yr of measurements (2000–2005) showing both the average conditions and the interannual variability. (a) NO, (b) NO2, (c) VOCs, (d) ozone, (e) PM2.5, (f) PM10, and (g) SO2.
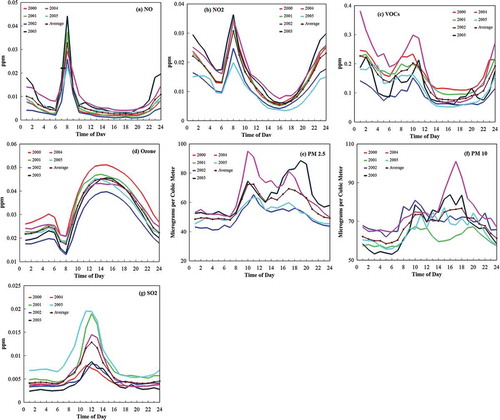
Figure 6. Seasonal patterns of air pollution in Yanbu. (a) NO, (b) NO2, (c) VOCs, (d) ozone, (e) PM2.5, and (f) SO2.
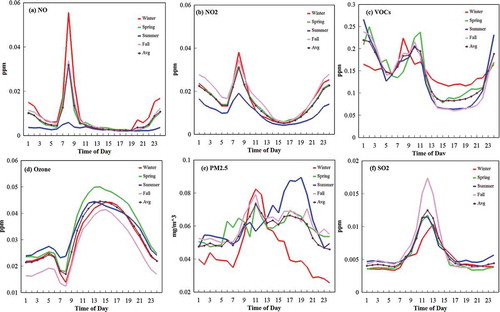
Figure 7. The weekend effect at Yanbu. (a) to (c) show that NO, NO2, and VOCs, respectively, are reduced during the weekend (Thursday–Friday), particularly on Fridays (−120 ± 30%, −34 ± 9%, and −12 ± 12%. Respectively, for daytime averages); however, in (d), we see that the ozone is slightly higher (+5 ± 3% for daytime averages). In (e), we see that SO2 is also lower on Fridays (−14 ± 12% day average) and (f) the PM2.5 particles are slightly lower.
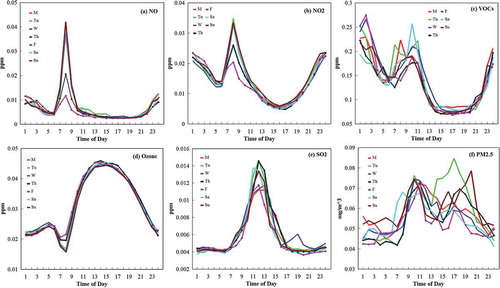
Figure 8. Percent change of criteria pollutants during the month of Ramadan in Yanbu relative to non-Ramadan months (see text). The results indicate increased nighttime activity and reduced emissions of NOx during the daytime.
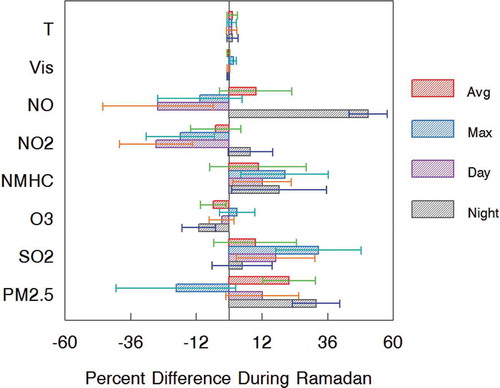
Figure 9. Percent change of air quality during major cultural events: Eid al-Fitr, Eid al-Adha, and the Hajj.
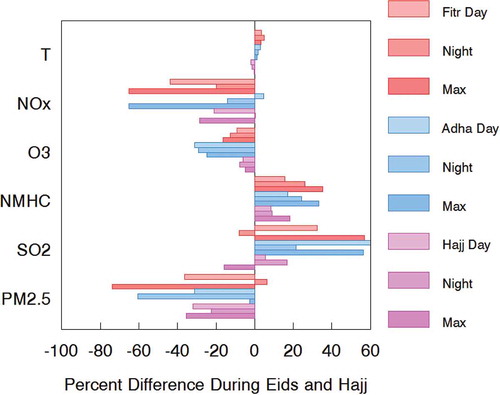
Table 1. Standards for criteria pollutants.
Table 2. Exceedances of criteria pollutants at Yanbu.
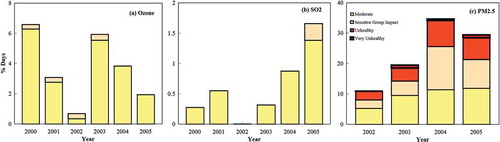
Figure 10. The EPA air quality index (AQI) applied to Yanbu for (a) ozone, (b) SO2, and (c) PM2.5. The index connects pollution levels directly to health impacts. At Yanbu, the air quality would be considered very good based on this index except for the high levels of fine particles that reached levels of concern during the course of the study and may be increasing. The PM2.5 is only from those days when the winds were low enough to have an assumed negligible effect from wind blown dust as shown in Figure 4 and discussed in the text.