1,089
Views
12
CrossRef citations to date
0
Altmetric
Technical Papers

Vehicle emission implications of drivers’ smart advisory system for traffic operations in work zones

, &
Pages 446-455 | Received 24 Aug 2015, Accepted 04 Jan 2016, Published online: 11 Apr 2016

Figures & data

Figure 1. (a) Scenarios LW and LA for a leading vehicle. (b) Scenario FF for a following vehicle.

Figure 1. (a) Scenarios LW and LA for a leading vehicle. (b) Scenario FF for a following vehicle.

Table 1. Definition of MOVES operating mode characteristics (EPA, Citation2011).

Table 2. Default operating mode bin average emission rates (g/h) in the MOVES model for selected pollutants: passenger cars, gasoline, 5 years old (Frey and Liu, Citation2013).

Figure 2. (a) Total emissions recorded in the advance warning area (LW). (b) Total emissions recorded in the activity area (LA). (c) Total emissions recorded in the forward collision warning area (FF).
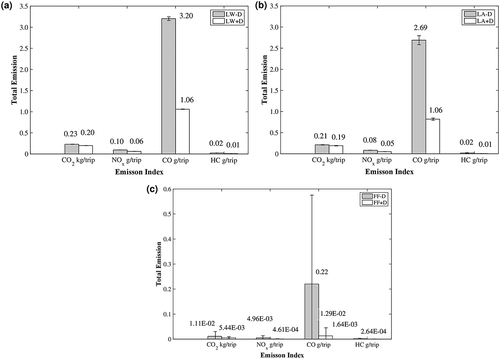
Figure 2. (a) Total emissions recorded in the advance warning area (LW). (b) Total emissions recorded in the activity area (LA). (c) Total emissions recorded in the forward collision warning area (FF).

Table 3. Total emissions estimated in the six scenarios.

Table 4. Significant test results for the four studied vehicle emissions.

Figure 3. (a) Emission rates of CO2 for scenario LW. (b) Emission rates of NOx for scenario LW. (c) Emission rates of CO for scenario LW. (d) Emission rates of HC for scenario LW. (e) Emission rates of CO2 for scenario LA. (f) Emission rates of NOx for scenario LA. (g) Emission rates of CO for scenario LA. (h) Emission rates of HC for scenario LA.
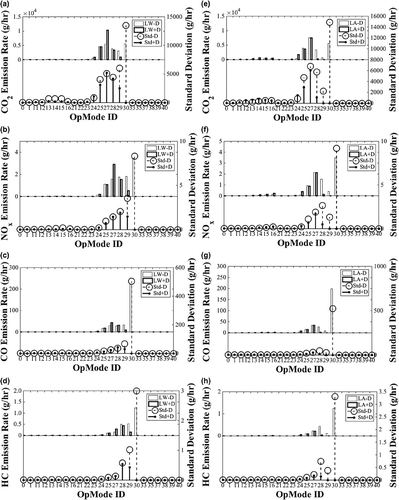
Figure 3. (a) Emission rates of CO2 for scenario LW. (b) Emission rates of NOx for scenario LW. (c) Emission rates of CO for scenario LW. (d) Emission rates of HC for scenario LW. (e) Emission rates of CO2 for scenario LA. (f) Emission rates of NOx for scenario LA. (g) Emission rates of CO for scenario LA. (h) Emission rates of HC for scenario LA.

Figure 4. (a) Emission rates of CO2 for scenario FF. (b) Emission rates of NOx for scenario FF. (c) Emission rates of CO for scenario FF. (d) Emission rates of HC for scenario FF.
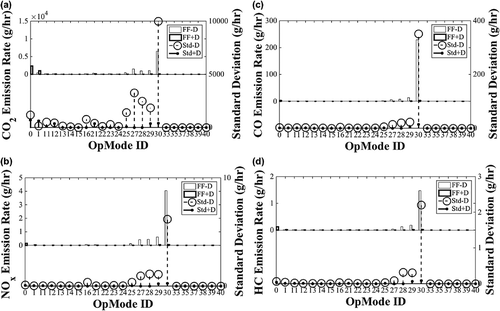
Figure 4. (a) Emission rates of CO2 for scenario FF. (b) Emission rates of NOx for scenario FF. (c) Emission rates of CO for scenario FF. (d) Emission rates of HC for scenario FF.
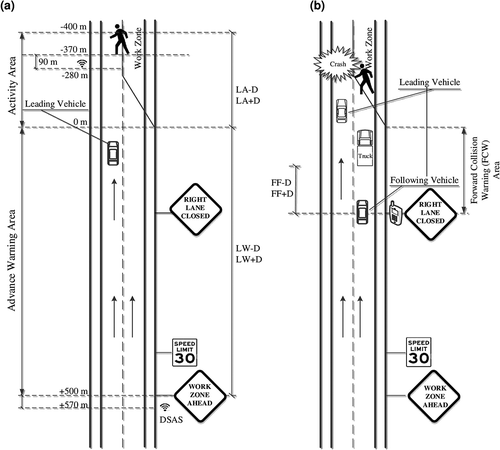
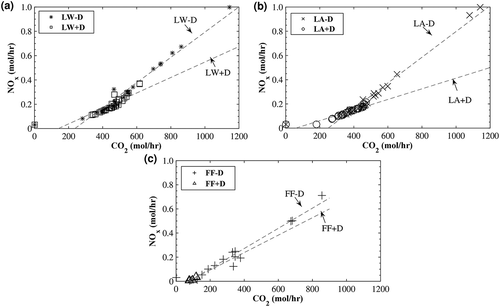
Figure 5. (a) NOx–CO2 diagram for LW. (b) NOx–CO2 diagram for LA. (c) NOx–CO2 diagram for FF.

Figure 5. (a) NOx–CO2 diagram for LW. (b) NOx–CO2 diagram for LA. (c) NOx–CO2 diagram for FF.

Reprints and Corporate Permissions

Please note: Selecting permissions does not provide access to the full text of the article, please see our help page How do I view content?

To request a reprint or corporate permissions for this article, please click on the relevant link below:

Academic Permissions

Please note: Selecting permissions does not provide access to the full text of the article, please see our help page How do I view content?

Obtain permissions instantly via Rightslink by clicking on the button below:

If you are unable to obtain permissions via Rightslink, please complete and submit this Permissions form. For more information, please visit our Permissions help page.