
Figures & data
Figure 1. Study area in South Philadelphia with monitoring sites associated with groups.
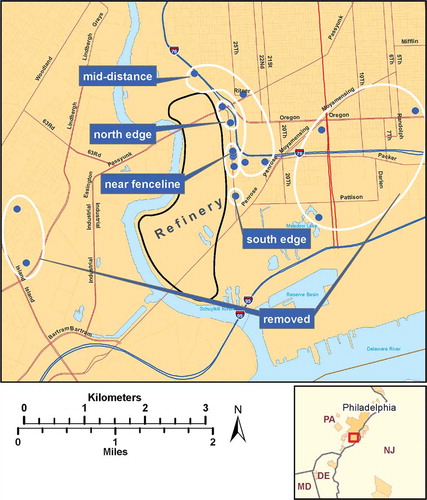
Figure 2. Mean frequencies of wind direction and speed at Philadelphia International Airport during the study. Frequencies indicate direction from which the wind is blowing.
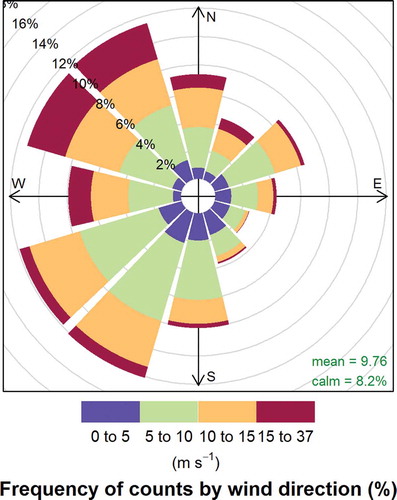
Table 1. Median values of VOCs in ppbv for all sites and each group,a median method detection limit (MDL, in ppbv) for study, and median percent coefficient of variation (CV) of duplicates for all sites.
Table 2. Results of site group comparisonsa.
Table 3. Summary of changes in statistical significance (10% level) for seasonal comparisons versus the entire period of sampling.
Supplemental material