Figures & data
Figure 1. Domain boundaries of the larger RDPS (green), and the inner RAQDPS and FireWork (blue). Superimposed on the map are locations of the 750 NRT PM2.5 surface measurement stations used in the model evaluation analysis, and the four geographical subregions used in the statistical analysis.
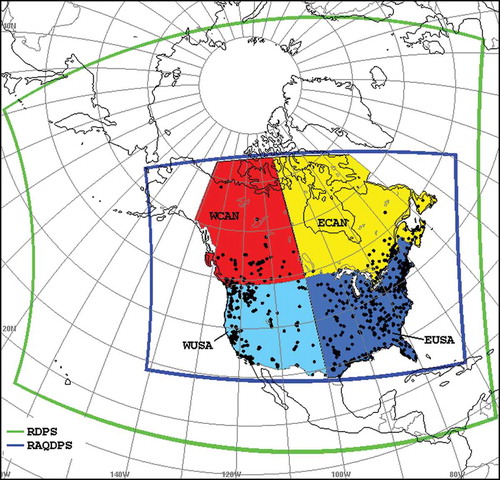
Figure 2. FireWork model system framework and data flow.
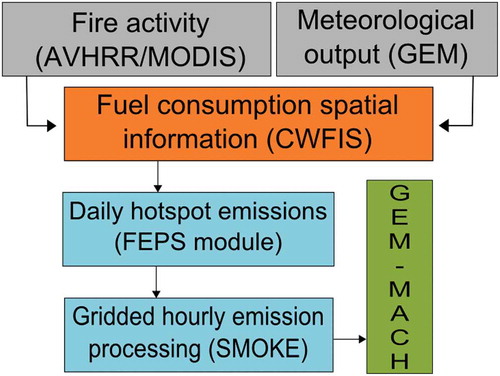
Figure 3. Left column shows mean temperature anomalies from climatology (1981–2010) for May, June, July, and August 2015 (panels (a), (c), (e), (g)). Right column shows the corresponding precipitation anomalies from climatology (panels (b), (d), (f), (h)).
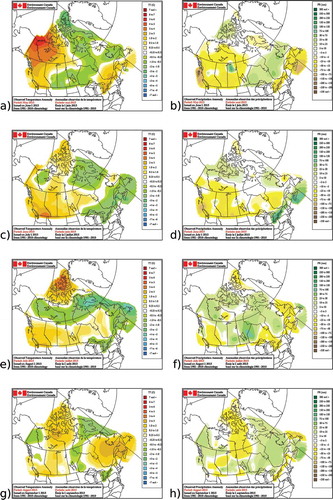
Figure 4. Total fuel consumption (TFC) per hotspot (kg m−2) for the period from June 2 to August 31, 2015, as reported by CWFIS (a), and the month when fire was first reported (b). A threshold where TFC > 1.0 kg m−2 is applied.
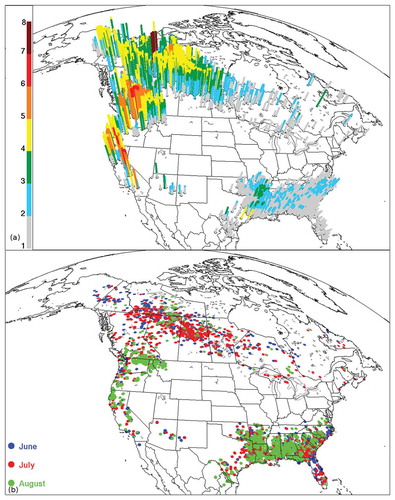
Table 1. RAQDPS and FireWork hourly performance statistics for surface PM2.5 for Canada and United States for period from June 2 to August 31, 2015.
Table 2. Categorical score definitions.
Table 3. RAQDPS and FireWork categorical scores based on hourly PM2.5 forecast and concentration threshold of 30 µg m−3 for Canada and United States for period from June 2 to August 31, 2015.
Figure 5. Total fuel consumption (TFC) per hotspot (kg m−2) for the period from June 24 to July 15, 2015, as reported by CWFIS.
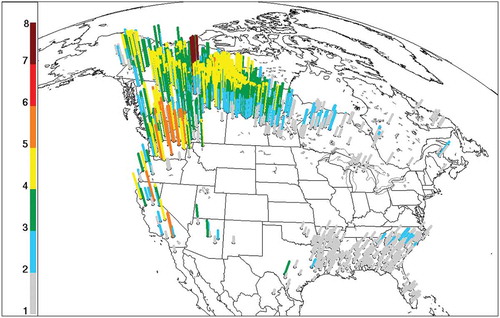
Figure 6. Number of wildfires started by day in Canada for the months of May, June, July, and August. The blue line represents values from a 10-year mean (2005–2014) (CIFFC, 2015).
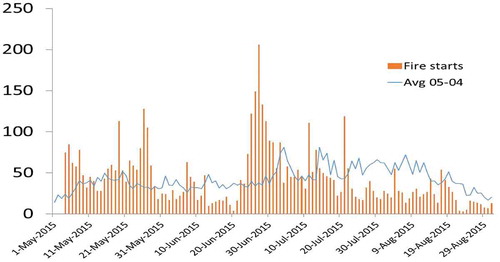
Figure 7. Total column PM2.5 concentration (left) forecast by FireWork (2015-06-28 00 UTC run), valid at June 29, 12 UTC, and (right) true color satellite image for June 29. Source: NASA Earth Observatory (http://earthobservatory.nasa.gov/NaturalHazards/view.php?id=86151).
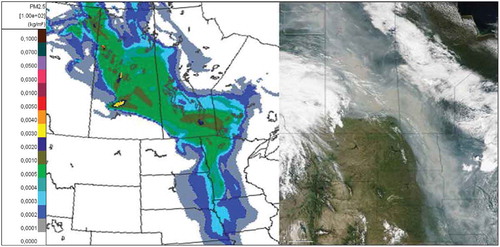
Table 4. RAQDPS and FireWork hourly performance statistics for surface PM2.5 for Canada and United States for period from June 24 to July 15, 2015.
Table 5. RAQDPS and FireWork categorical scores based on hourly PM2.5 forecast and concentration threshold of 30 µg m−3 for Canada and United States for period from June 24 to July 15, 2015.
Figure 8. Forecast wildfire emissions contribution to average surface PM2.5 concentrations (µg m3) for the period from June 24 to July 15, 2015. Graphical insert shows the zoomed region and measurement stations used for time-series analysis in .
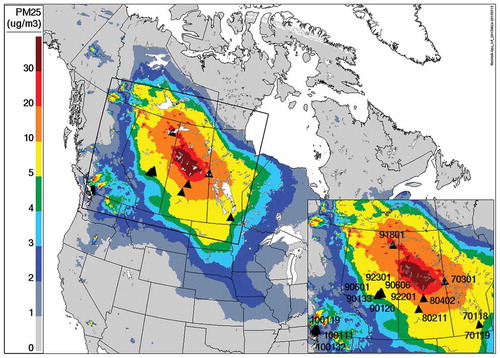
Figure 9. (a) Forecasted wildfire emissions contribution to average surface PM2.5 concentrations (μg m−3) at measurement stations, calculated by subtracting RAQDPS values from FireWork values, and (b) forecast PM2.5 correlation coefficient differences (FireWork – RAQDPS) when compared with hourly surface measurements for period from June 24 to July 15, 2015.
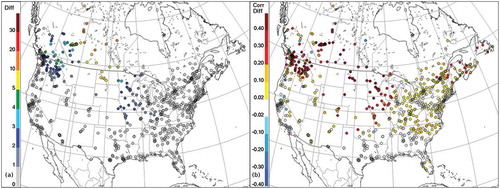
Figure 10. Time series of forecast and observed hourly PM2.5 surface concentrations (µg m3) in (a) Edmonton, AB (NAPS station 90120, 92201, 90601, 90606, 91101, 90133, 90130, 90121, and 92301), (b) Saskatoon, SK (NAPS station 80211), (c) Vancouver, BC (NAPS stations 100111, 100132, 100125, 100110, 100128, 100140, 101202, 100119 and 100134), (d) Winnipeg, MB (NAPS stations 70118 and 70119), (e) Fort Chipewyan, AB (NAPS station 91801), and (f) Prince Albert, SK (NAPS station 80402). FireWork forecasts are shown in red, RAQDPS forecasts are shown in blue, and observed concentrations are indicated by green points.
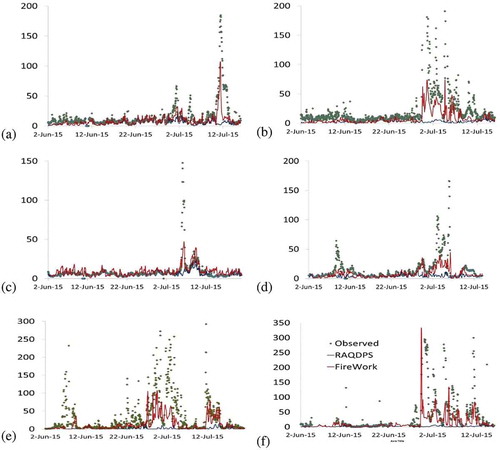
Figure 11. Total fuel consumption (TFC) per hotspot (kg m−2) for the period from August 15 to August 31, 2015, as reported by CWFIS.
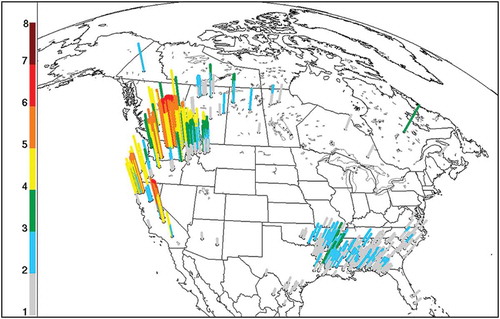
Table 6. RAQDPS and FireWork hourly performance statistics for surface PM2.5 for Canada and United States for period from August 15 to August 31, 2015.
Table 7. RAQDPS and FireWork categorical scores based on hourly PM2.5 forecast and concentration threshold of 30 µg m−3 for Canada and United States for period from August 15 to August 31, 2015.
Figure 12. Forecast wildfire emissions contribution to average surface PM2.5 concentrations (µg m3) for the period from August 15–31, 2015. Time series for the selected stations, presented on the zoomed image, are presented on .
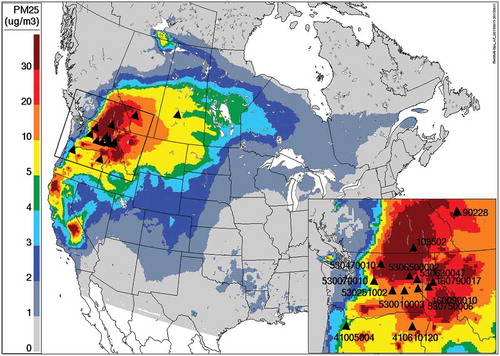
Figure 13. Same as , but for period August 15–31, 2015.
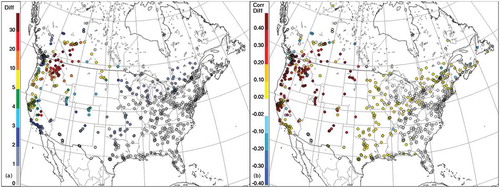
Figure 14. Upper figure represents forecast surface wind vectors and locations of FireWork hotspots (in red) valid at August 27, 06UTC. Blue dots represent FireWork model grid cell centers. Bottom figure represents time series of forecast and observed hourly PM2.5 surface concentrations (µg m3) for the Willpinit station (AQS station: 53060002). FireWork forecasts are shown in red, RAQDPS forecasts in blue, and the observed concentrations are in green points.
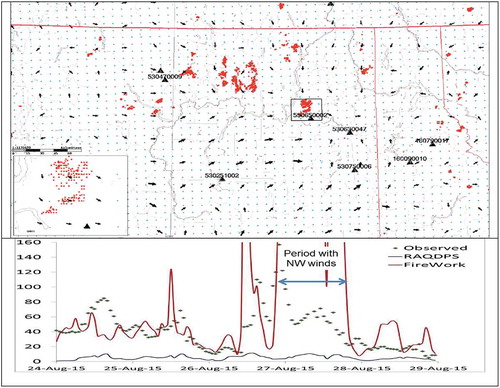
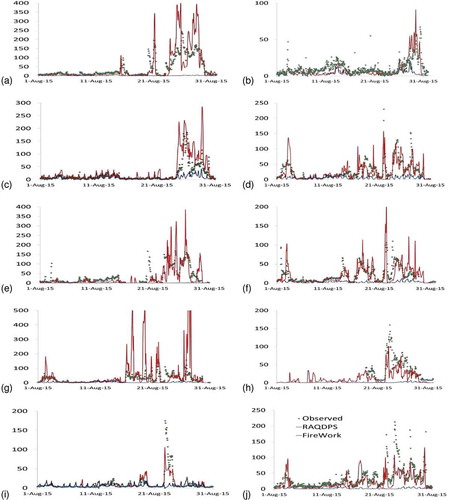
Figure 15. Time series of forecast and observed hourly PM2.5 surface concentrations (µg m3) in (a) Castlegar Zinio Park (NAPS station 103502) near Kelowna, BC, (b) Saskatoon, SK (NAPS station 80211), (c) Calgary, AB (NAPS stations 90228 and 9022), and AQS stations in the U.S.: (d) Spokane, WA (AQS station 530630047), (e) Winthrop, WA (AQS station 530470010), (f) Moses Lake, ID (AQS station 530251002), (g) Cove, OR (AQS station 410610120, (h) Willpinit, WA (AQS station 530650002), (i) Portland, OR (AQS stations 41005004 and 4100510080), and (j) Saint Maries, ID (AQS station160090010). FireWork forecasts are shown in red, RAQDPS forecasts are shown in blue, and observed concentrations are indicated by green points.