
Figures & data
Table 1. Chemical composition of raw materials and their percentages in mixture, wt%.
Table 2. Proximate analysis of coke breeze, wt%.
Table 3. Chemical composition and residual sulfur content of sinter, wt%.
Figure 1. Flow diagram of sintering process with FGR.
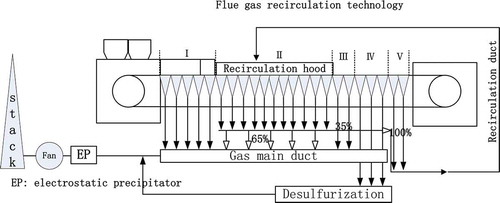
Table 4. Properties of circulating flue gas.
Table 5. Basic characteristics of each zone.
Figure 2. Schematic diagram of sinter zone simulation (1 gas, 2 valve, 3 flowmeter, 4 mixing box, 5 thermocouple, 6 electronic balance, 7 computer, 8 temperature controller, 9 quartz tube, 10 charging cup, 11 shaft furnace, 12 dryer, 13 gas analyzer).
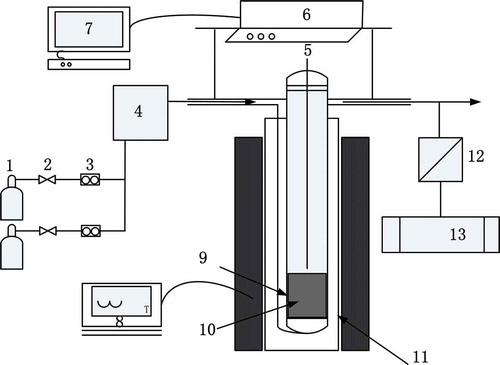
Table 6. Experimental conditions of each zone in detail.
Figure 3. Influence of sinter temperature on SO2 adsorption in the sinter zone.
Figure 4. Sulfur content in the sinter zone after adsorbing for 10 min at different temperatures.
Figure 5. Influence of f-CaO content on SO2 reaction behavior in the sinter zone.
Figure 6. Comparison of SO2 emission between conventional and FGR processes in the combustion zone.
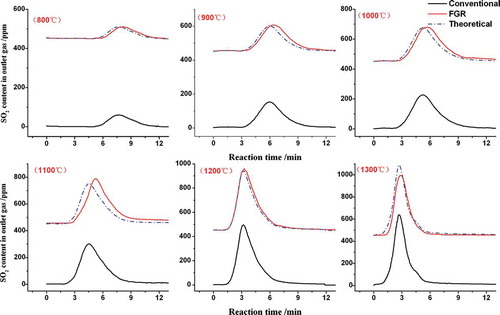
Figure 7. Influence of SO2 content and temperature on sulfur content in the drying–preheating zone.
Figure 8. Influence of SO2 content on sulfur content in the over-wet zones with different thickness.
Figure 9. Influence of FGR on SO2 transferring behavior.
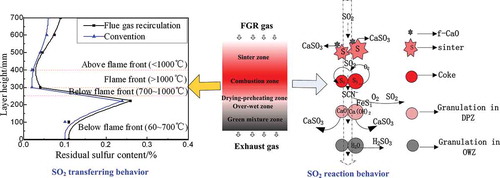
Table 7. Comparison of sulfur phase in the sinter sample before and after SO2 adsorption at 900ºC.
Table 8. Sulfur balance of granules in the combustion zone at 1300ºC.
Table 9. Comparison of sulfur phase in the unsintered zone before and after SO2 absorption.
Figure 10. Thermodynamic curve of sulfur retention behavior in unsintered zone.
Figure 11. Comparison of SO2 emission in exhaust gas between conventional and FGR techniques.
Table 10. Sulfur balance of sintering process in the case of air and FGR gas.