Figures & data
Figure 1. Topographical map of study domain with EPA ground stations.
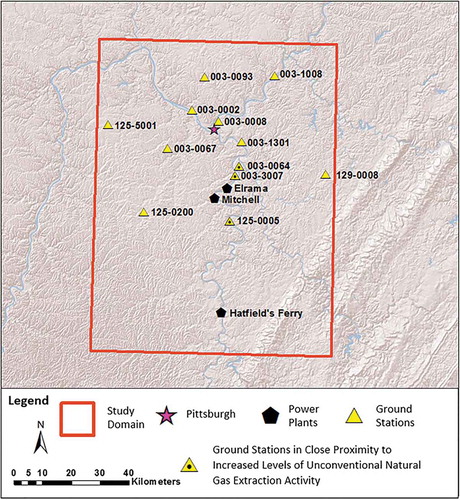
Table 1. PM2.5 means by closing period from EPA ground station locations.
Table 2. AOD means by closing period from EPA ground station locations.
Table 3. GAM results for two different dependent EPA ground station data sets.
Table 4. GAM results testing AOD as a predictor of ground station PM2.5 concentration.
Table 5. GAM results for dependent AOD data corresponding to the locations of 12 EPA ground stations (N = 562).
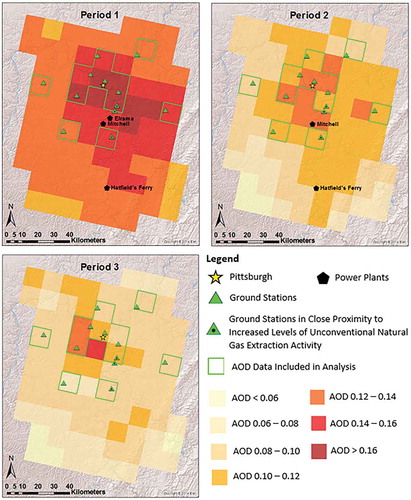
Figure 2. Combined Aqua and Terra AOD by closing period. Period 1 is January 2011 to October 2012, when all three plants were operating. Period 2 is November 2012 to October 2013, when Elrama was closed, but Hatfield’s Ferry and Mitchell were still open. Period 3 is November 2013 to December 2014, when all three plants were closed. Monthly AOD values were aggregated by season (winter = December, January, February; spring = March, April, May; summer = June, July, August; fall = September, October, November). The values displayed are averages by closing period and CMAQ grid cell, with each season equally weighted.