Figures & data
Figure 1. Air monitoring locations at KCBX North and South transfer facilities.
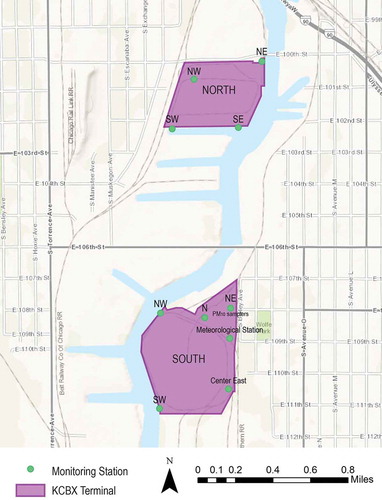
Figure 2. Wind rose developed from on-site meteorological measurements.
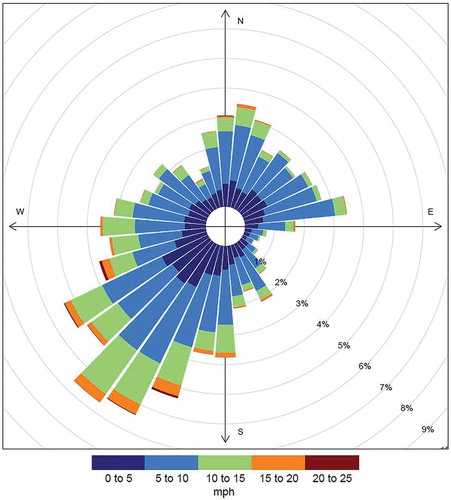
Figure 3. Locations of soil and wipe sampling near KCBX Terminals in Chicago, Illinois.
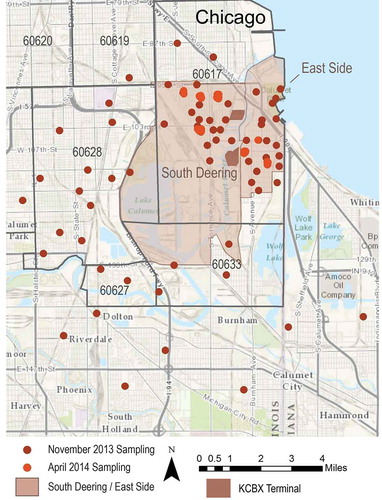
Table 1. Reference data used for comparison with on-site measurements.
Table 2. Composition data for different mixture types of petcoke.
Table 3. Summary of vanadium and nickel in source materials.
Figure 4. Histogram of 24-hr average PM10 concentrations at the KCBX Terminals, February 18, 2014, to April 4, 2015.
Table 4. AERMOD modeling predictions for maximum annual average and daily PM10 concentrations at residences near KCBX Terminals.
Table 5. Average (standard deviation) concentrations of sulfur, vanadium, and nickel in KCBX petcoke and grains of sidewalk dust.a
Figure 5. AERMOD-predicted PM10 concentrations with downwind distance from the KCBX South Terminal for January 15, 2013.
Figure 6. Vanadium-to-nickel ratios for source materials (petcoke and coal) compared with measured indicators.
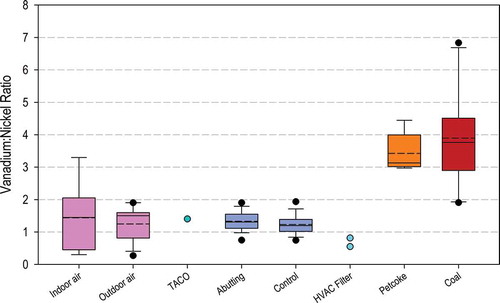
Figure 7. Correlation matrix of proportions of PAHs in abutting, control, reference, and source materials.