Figures & data
Table 1. Absorbents/adsorbents and analysis techniques for ozone pollutant though passive sampling.
Figure 1. Components of the Ogawa passive sampler. 1, diffuser end caps; 2, stainless screen; 3, impregnated filter with single-wall carbon nanotubes (SWCNTs); 4, body. Modified from Mulik et al. (Citation1991).
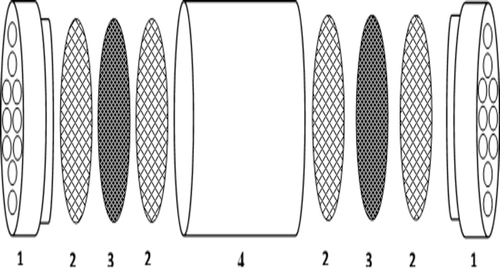
Table 2. The technical information of different ion chromatography analyses.
Figure 2. The course from November 2013 to May 2014 of the mean ground-level ozone concentrations as measured with passive samplers with the addition of respectively 0, 5, 10, and 50 mg/L single-wall carbon nanotubes (SWCNTs) on the absorption filters.
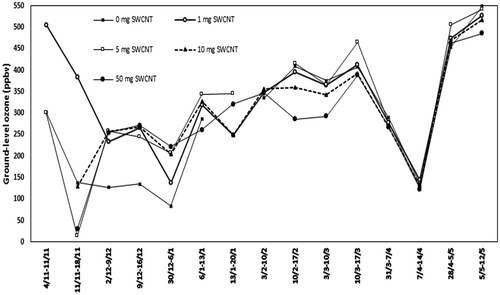
Figure 3. Comparison per exposure period of the ozone concentration of the passive samplers as measured with the addition of respectively 0, 1, 5, 10, and 50 mg/L single-wall carbon nanotubes (SWCNTs) on the absorption filters.
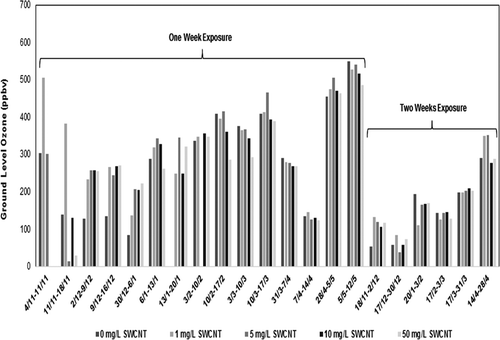
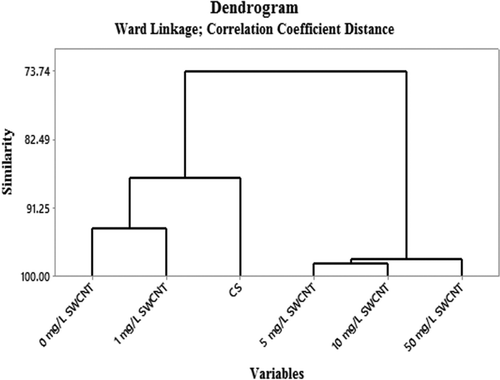
Figure 4. Dendrogram obtained from the hierarchical cluster analysis of similarities between the results of the passive samplers with respectively 0, 1, 5, 10, and 50 mg/L added single-wall carbon nanotubes (SWCNTs) to the absorption filters and the reference ozone monitor (CS).