Figures & data
Figure 1. Sampling locations and groups: (a) full view and (b) zoomed-in view with sensor locations and AMS open-path deployment.
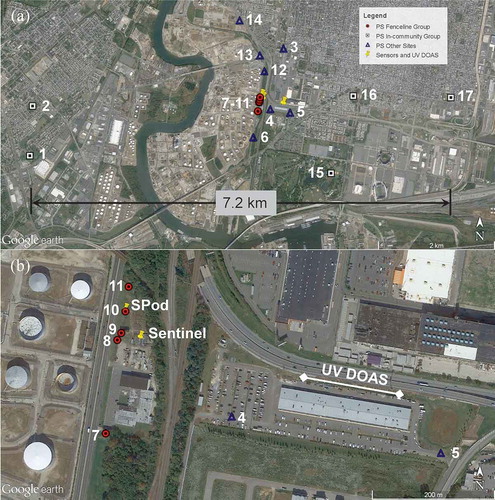
Table 1. Summary of passive sampler benzene data by period (before background subtraction).
Figure 2. PS duplicate comparisons for this study (N = 609 pairs).
Figure 3. (a) Minimum PS value by sample period, and (b) average period temperature.
Figure 4. PS benzene data by site, combining all sampling periods. The box whiskers extend to the largest measurement <1.5 times the interquartile range. Blue markers indicate means with 95% confidence intervals calculated by nonparametric bootstrap.
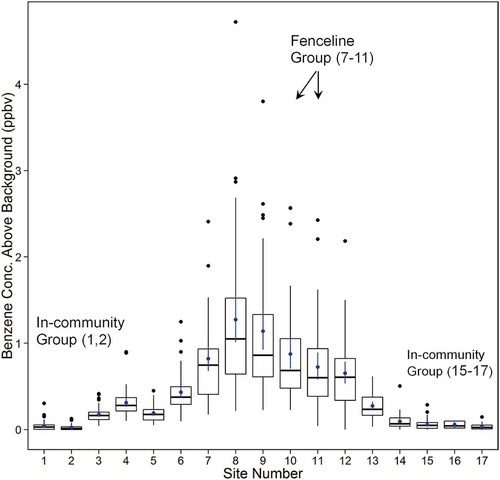
Figure 5. PS benzene data for the fenceline group by sampling period. The box whiskers extend to the largest measurement <1.5 times the interquartile range. Blue markers indicate means with 95% confidence intervals calculated by nonparametric bootstrap.
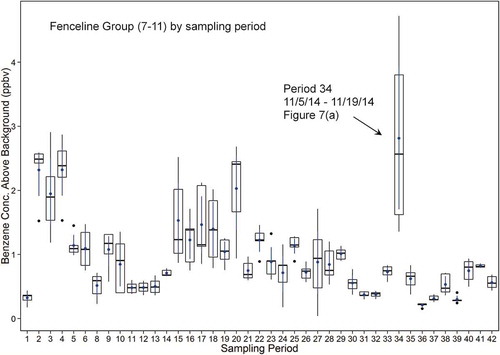
Figure 6. (a) PS benzene site means for all sampling periods vs. distance from nearest facility fenceline with site locations noted, and (b) gradient formed by the fenceline group and sites 4 and 5 for all sampling periods and for Period 34. Error bars indicate 95% confidence interval for means calculated by nonparametric bootstrap.
Figure 7. (a) Sensor and UV DOAS data for entire PS Period 34 (11/5/14–11/19/14) and (b) same from 12:00 a.m. on 11/15/14 to 12:00 p.m. on 11/16/14. Due to clock drift, there is an uncertainty (likely <1 hr) in the synchronization systems.
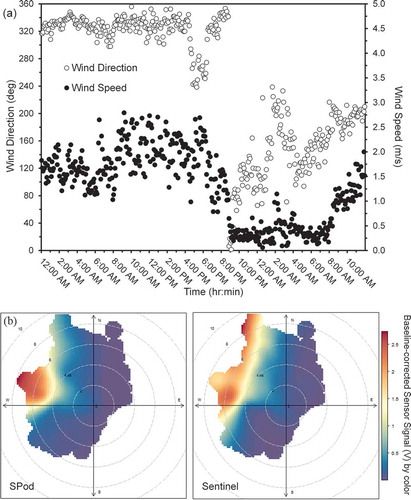
Figure 8. (a) Wind direction and speed from Sentinel Sensor from 12:00 a.m. on 11/15/14 to 12:00 p.m. on 11/16/14, and (b) SPod and Sentinel sensor responses (color bar) as function of wind direction and wind speed 11/15/14 12:00 a.m. to 12:00 p.m.