Figures & data
Table 1. Comparison of world-wide national air quality forecasting systems by executing organization, start year, and target pollutants.
Figure 1. Forecasting area at (a) the initial stage, (b) present.
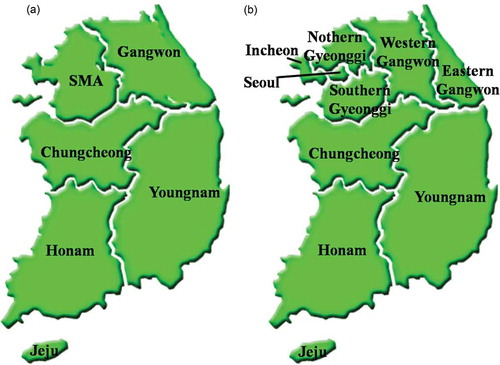
Figure 2. Schematic diagram of the national air quality forecast system.
Table 2. Statistics measures used in the forecast and model evaluation (complied from Boylan and Russell, Citation2006; Zhang et al., Citation2012a).
Figure 3. AQM modeling domains for NAQFMS. (a) Three model domains that have resolutions of 27km, 9km, 3km, respectively. (b) Spatial distribution of observations in South Korea; the Box is study area.
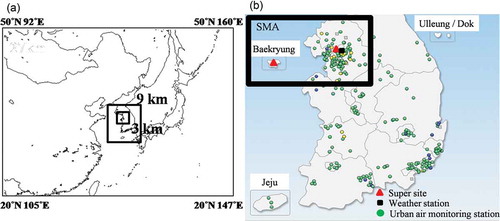
Table 3. Summarization of modeling experiments’ information.
Figure 4. Comparison of pollutants concentration between observation and model prediction for daily (a) PM10, (b) PM2.5, (c) O3, (d) NO2, (e) SO2.
Table 4. List of false forecast dates classified by four factors including emission, meteorology, model, and forecaster with false alarm dates during 1 September 2013 ~ 31 June 2015.
Figure 5. Two types of synoptic patterns for the false-forecasting high PM events in winter. The Siberian high pressure is expanded and turned into the migratory high pressure from Lake Baikal (a) to East China Sea and (b) to northeastern China (Reference: The COMET Program: www.meted.ucar.edu/oceans/northwall).
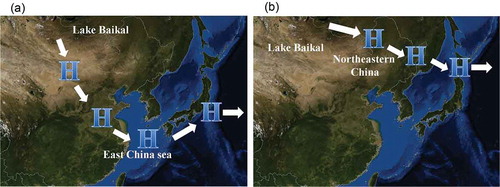
Figure 6. Comparison of the simulated both PM10 concentrations and surface wind speed in SMA for control run(GFS) and Exp. 1(UM).
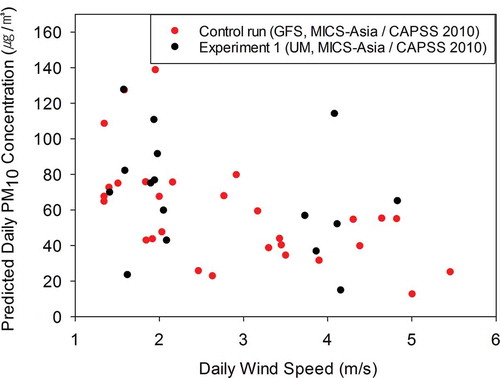
Figure 7. False forecasting case of February 27, 2014. Spatial distribution of the simulated PM10 concentration for (a) control run and (b) Experiment 1; (c) daily variation of the observed PM10 concentration in SMA with the simulated PM10 concentration for control run, Experiment 1 and 2.
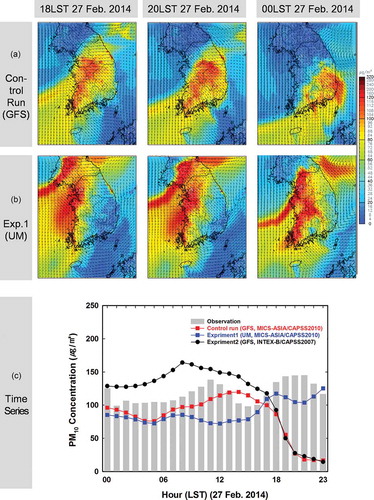
Figure 8. False forecasting case of June 02, 2014. (a) 850hPa weather chart (source: KMA); (b) time series of the simulated and observed hourly precipitation; (c) hourly variation of the simulated and observed PM10 concentration in SMA.
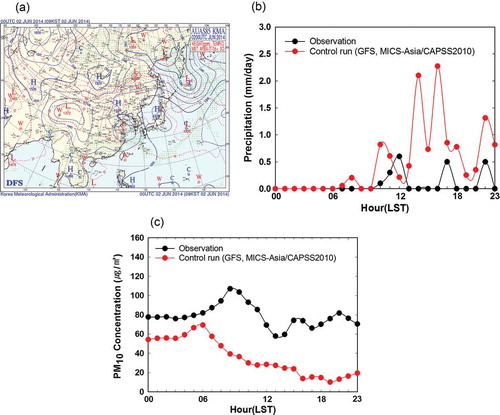
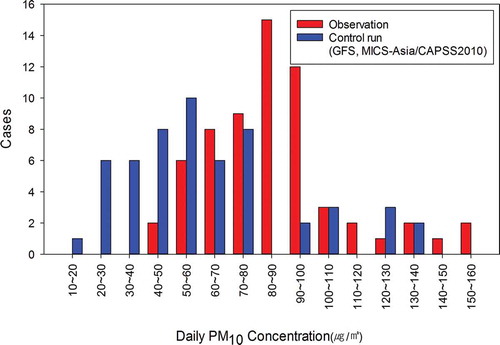
Figure 9. Comparison of observed and predicted 24-h average PM10 concentration from control run(GFS, MICS-Asia/CAPSS2010) and Exp. 2(GFS, INTEX-B/CAPSS2007) during (a) the evaluation period and (b) all false forecasting cases.
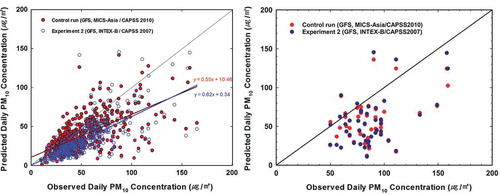
Table 5. The comparison of forecasting accuracy in terms of PM10 and PM2.5 mass, and major PM2.5 components depending on emission inventory when the forecasts were failed for 2014-year.
Figure 10. Mean fractional error (MFE) and mean fractional bias (MFB) for major components (Sulfate, OC, and EC) from control run (MICS-Asia) and Exp. 2(INTEX-B).
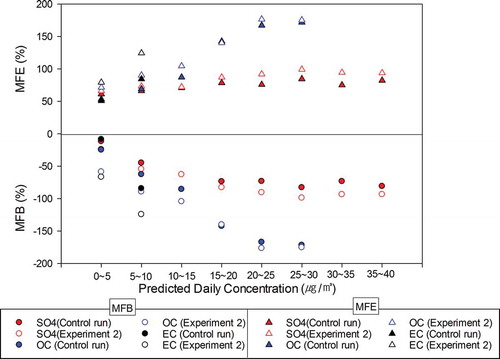
Figure 11. The comparison of the predicted PM from control run (MICS-Asia/CAPSS2010), Exp. 2(INTEX-B/CAPSS2007) and Exp. 3(MACC) concentrations with observations in the case of 2 May, 2014.
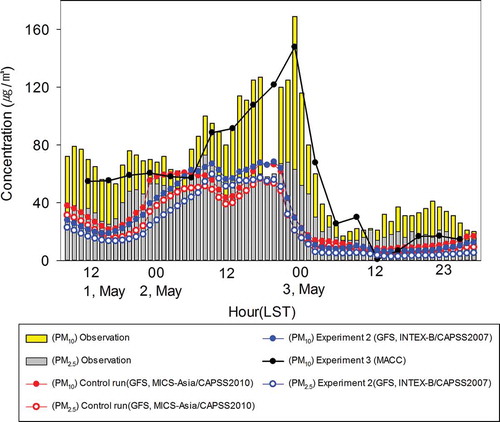
Figure 12. The daily variation of the predicted and observed (a) PM10 mass, (b) sulfate, (c) OC, and (d) EC on 15 March, 2 May, 17 June, 15 and 27 July in 2014 (Histogram: Observation, red dot: MACC, blue dot: CMAQ of control run).
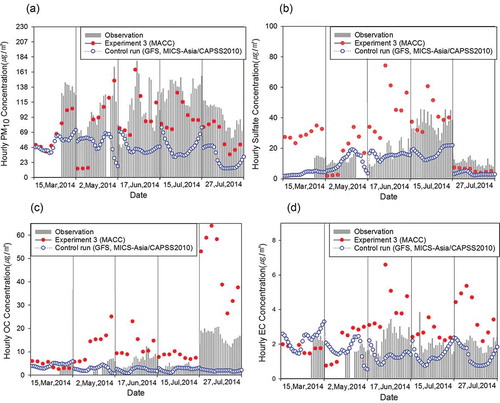
Figure 13. Comparison of the number of cases with 24-h average PM10 for the false alarms between observation and model.