
Figures & data
Figure 1. Study area and EPA monitoring network.
Figure 2. Box model dynamics.
Figure 3. Example of upwind cells identification. wd, Wind direction; N, north; NW, northwest; W, west.
Table 1. 10-Fold cross-validation: R2 (dimensionless) and RMSE (μg/m3).
Figure 4. Estimated emission in U.S. Northeast.
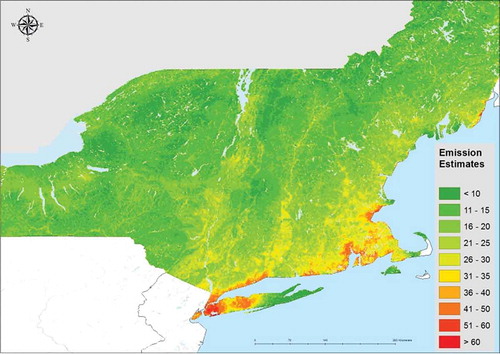
Figure 5. Estimated emission in (a) Greater Boston, MA, (b) New York, NY, and (c) Providence, RI. Land cover type from NLCD 2011 database in (d) Greater Boston, (e) New York, and (f) Providence. Population of year 2000 in (g) Greater Boston, (h) New York, and (i) Providence.
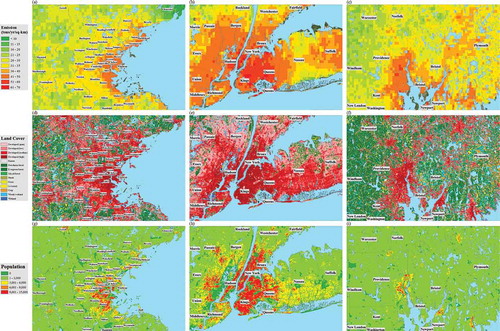
Table 2. LUR estimated emission from different land use for U.S. Northeast.
Figure 6. Residual map of land use regression (LUR) model in (a) the U.S. Northeast and (b) Massachusetts. The residuals are emissions that are not related to land use parameters.
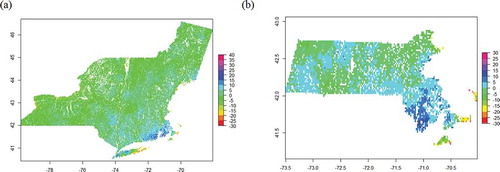
Table 3. LUR estimated emission from different land use for Massachusetts.
Figure 7. (a) Estimated emission vs. EPA NEI nonpoint emission in (b) 2008 and (c) 2011 at county level.
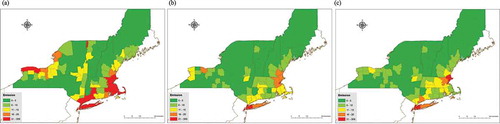
Table 4. Evaluation results of estimated emission vs. EPA NEI emission 2008 at county level.
Table 5. Evaluation results of emission estimates vs. EPA NEI emission 2011 at county level.