
Figures & data
Figure 1. Schematic diagram of the experimental setup.
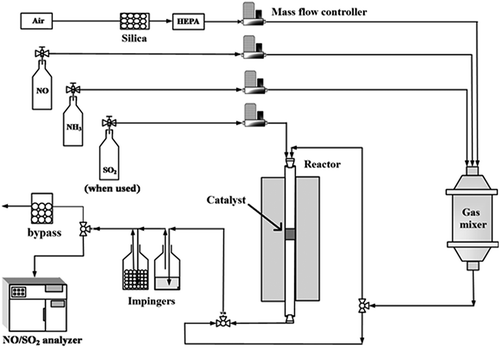
Table 1. Characterization of the MnFe-TiO2 and MnFe-TNT catalysts.
Figure 2. SEM images of catalysts prepared at calcination temperature 350 °C: (a) MnFe-TiO(OH)2; (b) MnFe-TNT(TiO(OH)2).
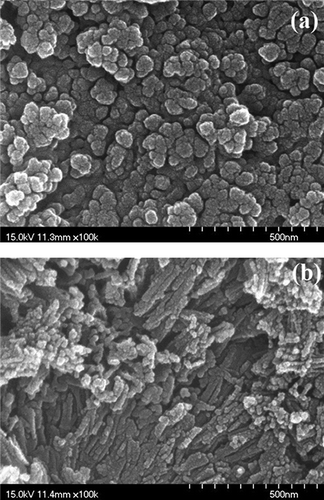
Figure 3. XRD patterns of catalysts prepared under different calcination temperatures: (a) MnFe-TiO2; (b) MnFe-TNTs.
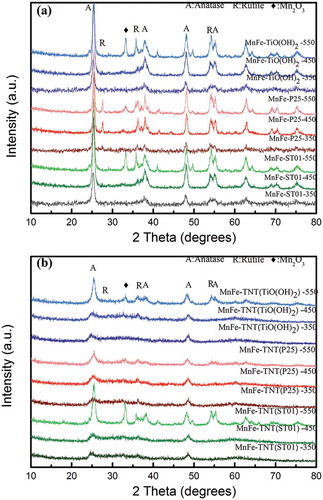
Figure 4. NH3-TPD patterns of MnFe-TiO2 and MnFe-TNT catalysts at calcination temperature of 350 °C. The solid lines represent for the results of MnFe supported on TiO2, whereas the dash lines are for those on TNTs.
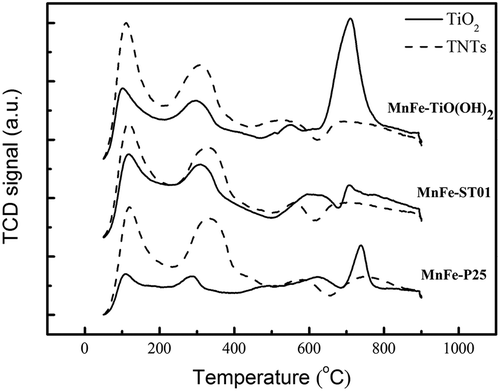
Figure 5. NH3-TPD patterns of (a) MnFe-TiO2 and (b) MnFe-TNTs (both made from TiO(OH)2) calcined at different temperatures.
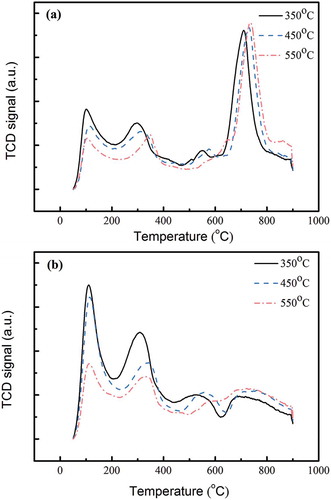
Figure 6. Correlation between NH3-TPD desorption amounts (200~500 °C, Brønsted acid sites) and the specific surface areas of all TiO2- and TNT-based MnFe catalysts.
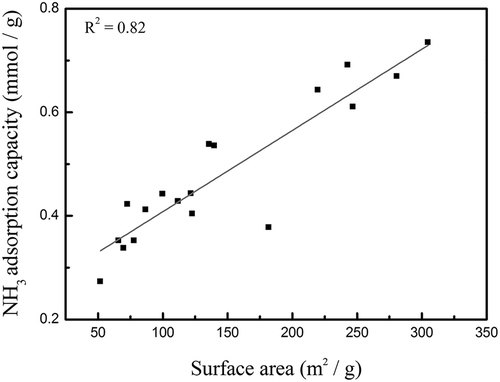
Figure 7. Comparison of NO conversion between TiO2- and TNT- (both made from TiO(OH)2) based MnFe catalysts calcined at 350 °C in the NH3-SCR reaction. Reaction conditions: reaction temperature = 150 °C, [NO] = 220 ppm, [NH3] = 200 ppm, [SO2] = 100 ppm, [O2] = 15%, balanced with air, and GHSV = 20,000 hr−1.
![Figure 7. Comparison of NO conversion between TiO2- and TNT- (both made from TiO(OH)2) based MnFe catalysts calcined at 350 °C in the NH3-SCR reaction. Reaction conditions: reaction temperature = 150 °C, [NO] = 220 ppm, [NH3] = 200 ppm, [SO2] = 100 ppm, [O2] = 15%, balanced with air, and GHSV = 20,000 hr−1.](/cms/asset/75a5b445-94cb-44bb-8494-7d3dfe1b3f7c/uawm_a_1231144_f0007_b.gif)
Figure 8. NO conversion with and without the presence of SO2 in the NH3-SCR reaction over MnFe-TiO2 and MnFe-TNT (both made from TiO(OH)2) catalysts at different calcination temperatures. Reaction conditions: reaction temperature = 150 °C, [NO] = 220 ppm, [NH3] = 200 ppm, [SO2] = 100 ppm, [O2] = 15%, balanced with air, and GHSV = 20,000 hr−1.
![Figure 8. NO conversion with and without the presence of SO2 in the NH3-SCR reaction over MnFe-TiO2 and MnFe-TNT (both made from TiO(OH)2) catalysts at different calcination temperatures. Reaction conditions: reaction temperature = 150 °C, [NO] = 220 ppm, [NH3] = 200 ppm, [SO2] = 100 ppm, [O2] = 15%, balanced with air, and GHSV = 20,000 hr−1.](/cms/asset/20936dac-52a3-4fb3-b392-46b35903f263/uawm_a_1231144_f0008_b.gif)
Figure 9. The effect of specific surface area of catalysts on the NO conversion at SCR temperature of 150 °C with and without the presence of SO2. The data of without SO2 were averaged over 3 hr of operation time, whereas the data with SO2 was after 5 hr of SO2 poisoning.
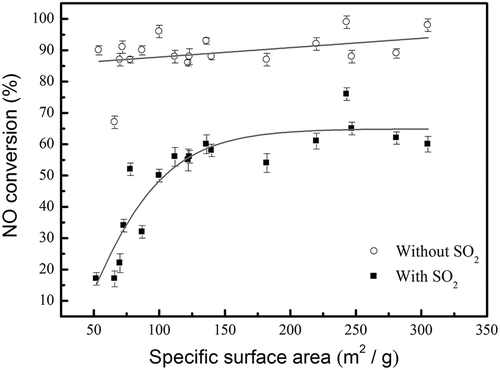
Figure 10. XPS spectra of Mn 2p spectra for (a) MnFe-TiO2 and (b) MnFe-TNTs before and after poisoning by SO2. The two MnFe-TiO2 and MnFe-TNT catalysts were both made from TiO(OH)2.
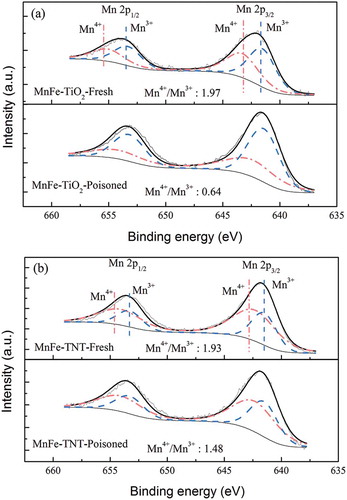
Figure 11. Effect of gas hourly space velocity (GHSV) on the NO conversion over the MnFe-TNT(TiO(OH)2)(350) catalyst. Reaction conditions: reaction temperature = 150 °C, [NO] = 220 ppm, [NH3] = 200 ppm, [SO2] = 100 ppm, [O2] = 15%, balanced with air.
![Figure 11. Effect of gas hourly space velocity (GHSV) on the NO conversion over the MnFe-TNT(TiO(OH)2)(350) catalyst. Reaction conditions: reaction temperature = 150 °C, [NO] = 220 ppm, [NH3] = 200 ppm, [SO2] = 100 ppm, [O2] = 15%, balanced with air.](/cms/asset/f4e13f64-a52c-44ee-9265-7b413ea23ab0/uawm_a_1231144_f0011_b.gif)
Figure 12. Effect of reaction temperature on the NO conversion over the MnFe-TNT(TiO(OH)2)(350) catalyst. Reaction conditions: [NO] = 220 ppm, [NH3] = 200 ppm, [SO2] = 100 ppm, [O2] = 15%, balanced with air, and GHSV = 20,000 hr−1.
![Figure 12. Effect of reaction temperature on the NO conversion over the MnFe-TNT(TiO(OH)2)(350) catalyst. Reaction conditions: [NO] = 220 ppm, [NH3] = 200 ppm, [SO2] = 100 ppm, [O2] = 15%, balanced with air, and GHSV = 20,000 hr−1.](/cms/asset/40f4f8f7-3110-4475-8035-4bd12a4686c0/uawm_a_1231144_f0012_b.gif)
Figure 13. Effect of [NH3]/[NO] ratio on the NO conversion over the MnFe-TNT(TiO(OH)2)(350) catalyst. Reaction conditions: reaction temperature = 150 °C, [NO] = 220 ppm, [NH3] = 200~400 ppm, [SO2] = 100 ppm, [O2] = 15%, balanced with air, and GHSV = 20,000 hr−1.
![Figure 13. Effect of [NH3]/[NO] ratio on the NO conversion over the MnFe-TNT(TiO(OH)2)(350) catalyst. Reaction conditions: reaction temperature = 150 °C, [NO] = 220 ppm, [NH3] = 200~400 ppm, [SO2] = 100 ppm, [O2] = 15%, balanced with air, and GHSV = 20,000 hr−1.](/cms/asset/89dbefb9-ff3d-464e-bc5b-b6c7ad3d54f6/uawm_a_1231144_f0013_b.gif)
Figure 14. (a) TGA spectra and (b) DTG spectra of fresh and poisoned catalysts. Reaction conditions: reaction temperature = 150 °C, [NO] = 220 ppm, [NH3] = 200 ppm, [SO2] = 100 ppm, [O2] = 15%, balanced with air, and GHSV = 20,000 hr−1.
![Figure 14. (a) TGA spectra and (b) DTG spectra of fresh and poisoned catalysts. Reaction conditions: reaction temperature = 150 °C, [NO] = 220 ppm, [NH3] = 200 ppm, [SO2] = 100 ppm, [O2] = 15%, balanced with air, and GHSV = 20,000 hr−1.](/cms/asset/845bf885-df9f-4fd3-bc63-eb51a4cc7ea3/uawm_a_1231144_f0014_b.gif)
Table 2. The specific surface areas after SO2 poisoning and the amounts of SO2 poisoning products on the MnFe-TiO(OH)2 and MnFe-TNT(TiO(OH)2) catalysts.