
Figures & data
Figure 1. Study areas. (a) Map of Greece and the (b) Greater Thessaloniki Area, (c) Western Macedonia Lignite Area, (d) Volos Area, (e) Patras Area, and (f) Greater Athens Area. The locations of the monitoring sites in each area are shown as red diamonds.
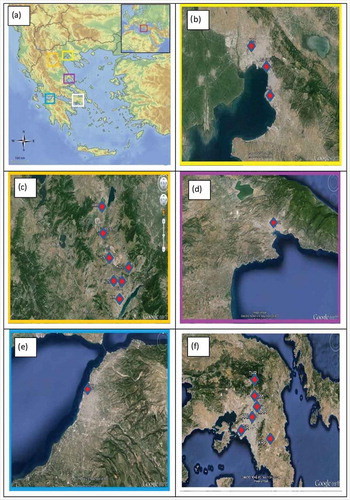
Table 1. Characteristics of the monitoring stations used in the study.
Table 2. Classification of extreme PM10 pollution episodes in Greece, 2009–2011.
Figure 2. Mean PM10 concentrations in the Western Macedonia Lignite Area (WMLA), Greater Athens Area (GAA), Greater Thessaloniki Area (GTA), Patras Area (PA), and Volos Area (VA) during the two LSI EEs from November 18 to 25, 2009, and from November 19 to December 4, 2011. The lines in the bars indicate standard deviations.
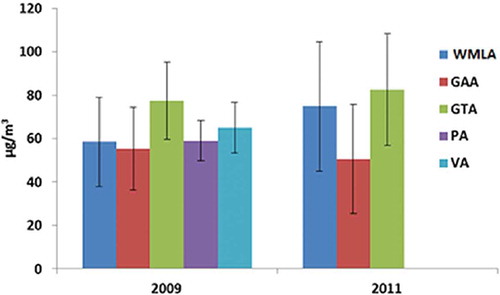
Figure 3. Average daily PM10 concentrations measured in the Western Macedonia Lignite Area (WMLA) and Greater Athens Area (GAA) from November 11 to December 7, 2011. The red horizontal line indicates the daily PM10 concentration limit (50 μg/m3).
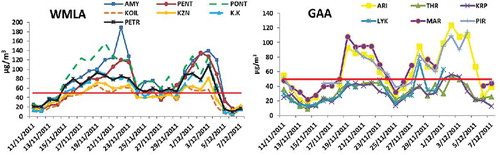
Figure 4. Synoptic meteorological conditions during the second recorded LSI EE, which occurred between November 19 and December 4, 2011. Synoptic surface pressure maps from (a) November 19, (c) November 24, (e) November 28, and (g) December 5, 2011. (b) Synoptic pressure at 500 mb on November 19, 2011. Precipitation rate (mm/day) on (d) November 24 and (h) December 5, 2011. (f) Omega vertical velocity (Pa/sec) on November 28, 2011.
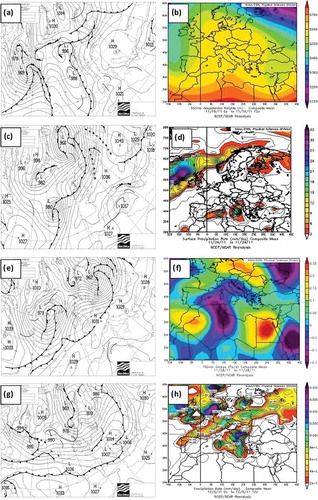
Figure 5. Average vertical profile of potential temperature, θ (K), during specific hours, from November 19 to December 4, 2011, in all study areas.
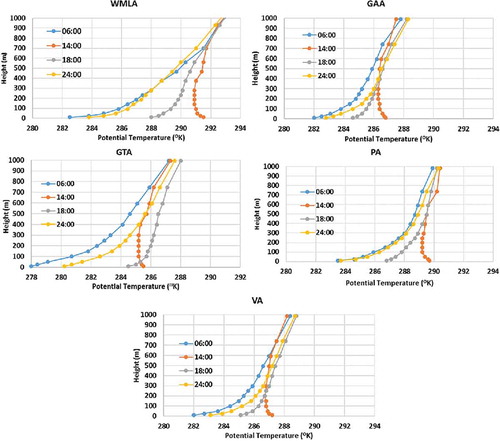
Figure 6. Surface wind field calculated by TAPM in the Western Macedonia Lignite Area (WMLA), Greater Athens Area (GAA), Greater Thessaloniki Area (GTA), Patras Area (PA), and Volos Area (VA) at the (a) beginning and (b) end of the LSI EE in November–December 2011.
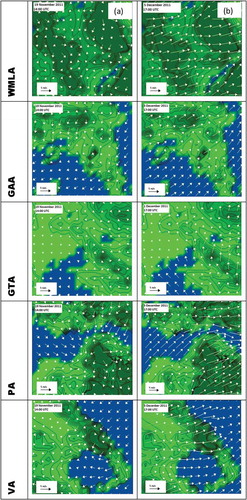
Figure 7. Images and maps of African dust transport in Greece during a representative (a) cold period (February 20, 2010), (b) warm period (June 13–18, 2010), and (c) transition period (March 22–23, 2010). (I) Satellite image, (II) surface pressure map, (III) geopotential height 850 hPa, (IV) anomaly at 700 hPa, (V) vector winds at 500 hPa.
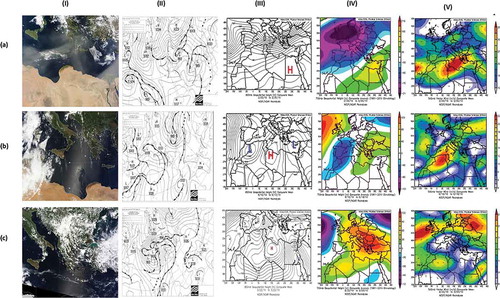
Figure 8. Mean PM10 concentrations during ADI EEs in Greece for (a) each area (lines in the bars indicate the standard deviations), and daily mean PM10 concentrations during the representative (b) cold period (February 20, 2010), (c) warm period (June 13–18, 2010), and (d) transition period (March 22–23, 2010).
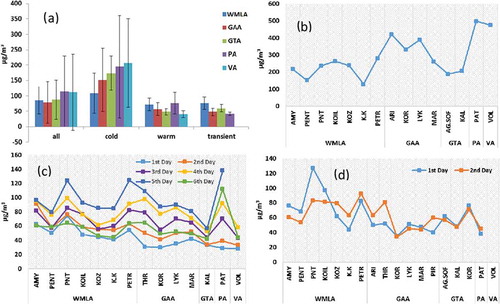
Figure 9. Back trajectories of air masses arriving at the Kozani monitoring station in WMLA at 500, 1500, and 3000 m AGL in representative (a) cold period (February 20, 2010), (b) cold period (November 12, 2010), (c) warm period (June 13, 2010), and (d) transition period (March 22, 2010) showing long-range transport of African desert dust to Greece.
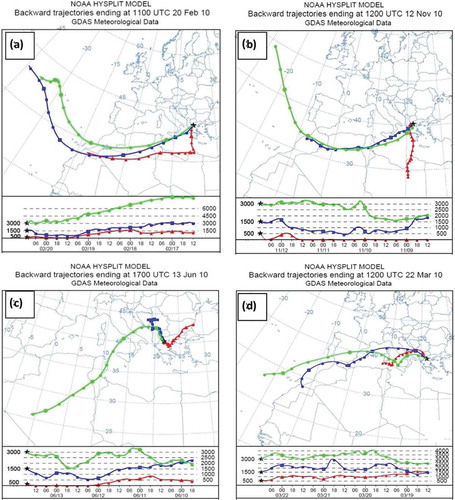
Figure 10. Typical PM10 dispersion conditions in the (a) Western Macedonia Lignite Area (WMLA), (b) Greater Athens Area (GAA), (c) Greater Thessaloniki Area (GTA), (d) Patras Area (VA), and (e) Volos Area (PA) during ADI EEs.
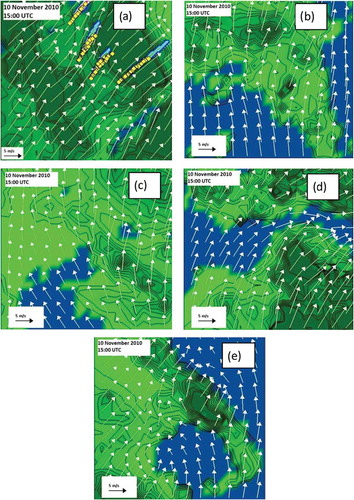
Figure 11. Hourly variations in surface wind speed and ground PM10 concentrations measured at three WMLA monitoring stations during a representative (a) LSI EE (17–19 November 2011) and (b) ADI EE (20 February 2010).
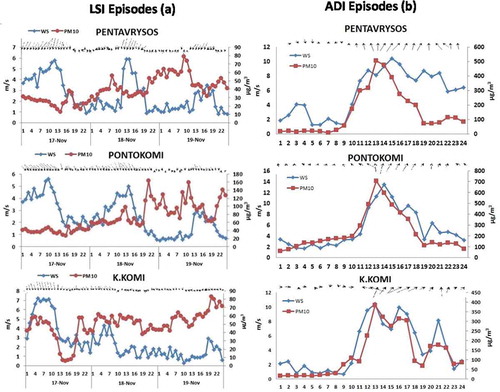
Figure 12. Contributions of EE LSI to PM10 concentrations (μg/m3) in the Western Macedonia Lignite Area (KOIL MS, PNT MS), Greater Athens Area (THR MS, ARI MS), Greater Thessaloniki Area (AG. SOF MS, KOR MS), Patras Area (PAT MS), and Volos Area (VOL MS).
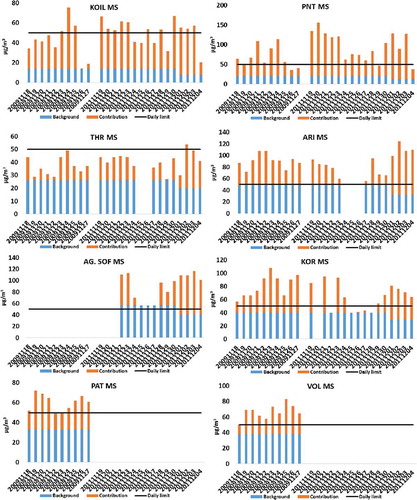
Figure 13. Contributions of ADI EEs to PM10 concentrations (μg/m3) in the Western Macedonia Lignite Area (K.K. MS, PNT MS), Greater Athens Area (MAR MS, ARI MS), Greater Thessaloniki Area (AG.SOF MS, KOR MS), Patras Area (PAT MS), and Volos Area (VOL MS).
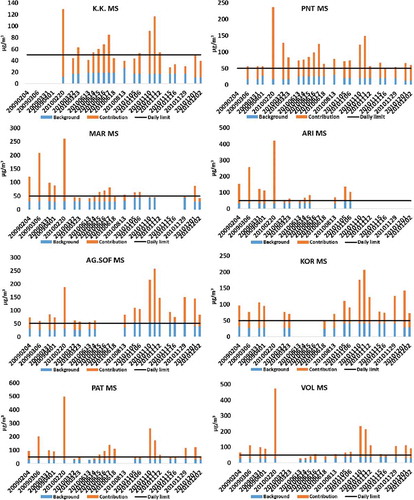
Table 3. Percentage contributions of EEs to the PM10 levels in the five study areas.
Table 4. Relative contribution of African Dust Impact (ADI) and Local Source Impact (LSI) extreme episodes to PM10 concentrations in Greece.