Figures & data
Table 1. Locations of air sampling at DWPS.
Figure 1. Satellite image showing the ambient air quality monitoring locations at the DWPS.
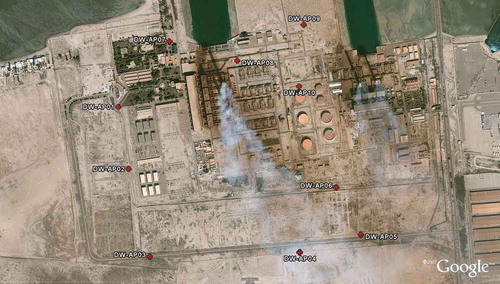
Table 2. Meteorological data at each sampling point around DWPS.
Figure 2. (a) The wind rose plot of the sampling point DWPS-AP05. (b) The wind class frequency distribution of the sampling point DWPS-AP05.
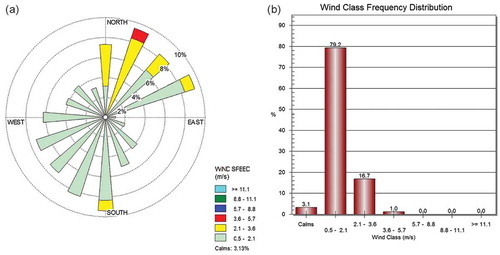
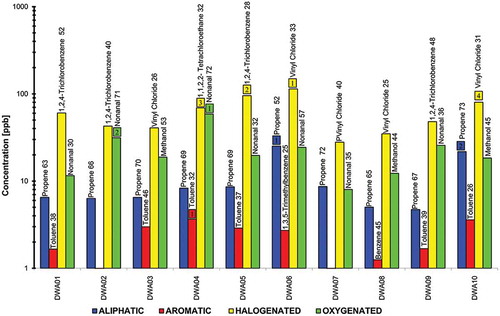
Table 3. Total VOC concentrations and the most abundant compounds at selected locations around DWPS.
Figure 3. The most abundant compounds around DWPS.