Figures & data
Figure 1. Percentage of respondents who reported involvement with the specified activities in their current position.
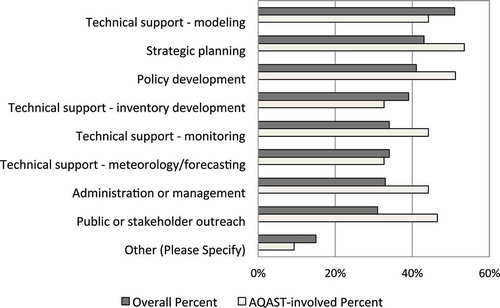
Table 1. Mean and standard deviation of responses to the question “Which air quality management issues are active challenges for your agency?” with 1 = not an issue, 2 = somewhat challenging, 3 = more challenging, and 4 = major challenge, and percentage of respondents who included the item in response to the question “For which three air quality management issues does your agency have the greatest need for improved scientific or technical information?”
Table 2. Mean and standard deviation of responses to the question “In order to carry out your professional responsibilities, which types of scientific or technical information do you use?” with 1 = never, 2 = infrequently, 3 = occasionally, 4 = more often, and 5 = frequently, and percentage of respondents who included each item in response to the question “Of the types of scientific or technical resources you use, which three have the greatest need for improvement?”
Table 3. Percentage of responses to the question “For what purpose, if any, are the following technical resources used within your agency?”
Figure 2. Percentage of respondents who indicated that each issue remains a barrier to use of satellite data by their organization, for respondents who indicated that their agency had some involvement with AQAST and those whose agency did not.
Figure 3. Mean and standard deviation of responses to the request “Please rate your agency’s experience working with AQAST researchers on the following dimensions” with 1 = strongly disagree, 2 = disagree, 3 = neutral, 4 = agree, and 5 = strongly agree (N = 53).