Figures & data
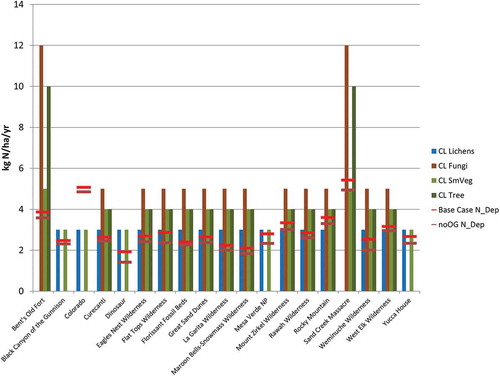
Figure 1. The CAMx modeling domain showing the outer 36-km domain covering the entire United States and the nested 12-km domain covering the western U.S. national parks, which are outlined in blue, and non-NPs Class I areas, which are in green. The extent of major U.S. oil and gas basins as of 2011 is shown in pink.
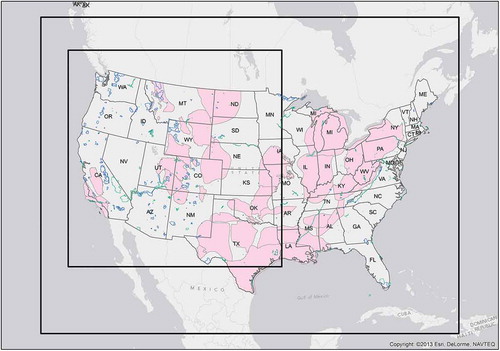
Figure 2. Modeled contribution of emissions associated with oil and gas production activity to the fourth highest daily maximum 8-hr averaged ozone concentration in ppb. National parks and Class I areas are outlined in black.
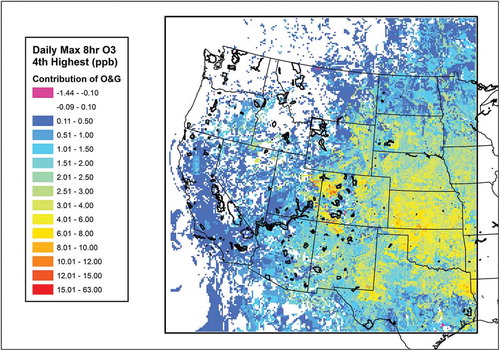
Figure 3. Modeled contribution of emissions associated with oil and gas production activity to annual average PM2.5 concentration. National parks and Class I areas are outlined in black.
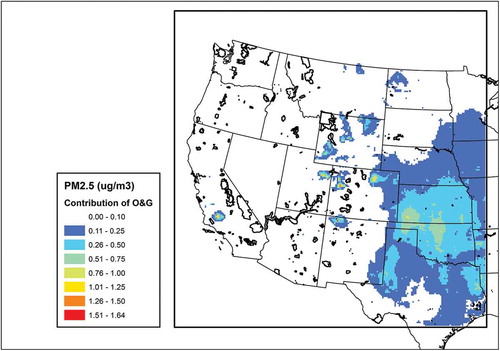
Figure 4. Modeled contribution of emissions associated with oil and gas production activity to visibility on the 20% haziest days. National parks and Class I areas are outlined in black.
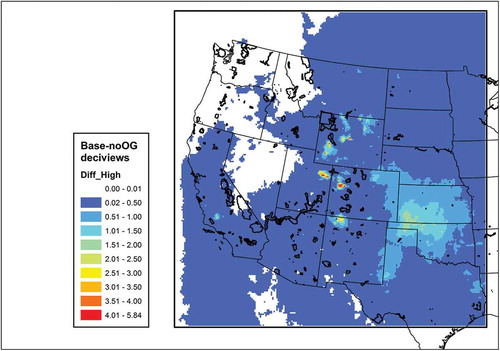
Figure 5. Modeled contribution of emissions associated with oil and gas production activity to visibility on the 20% clearest days. National parks and Class I areas are outlined in black.
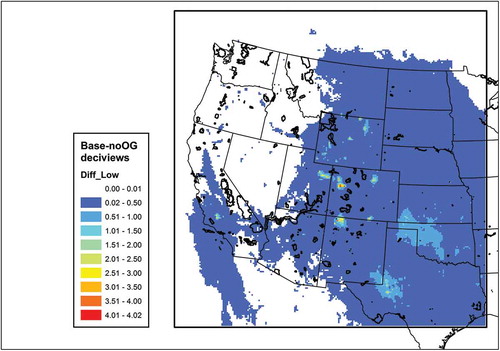
Figure 6. Modeled contribution of emissions associated with oil and gas production activity to total nitrogen deposition (kg N/ha/year). National parks and Class I areas are outlined in black.
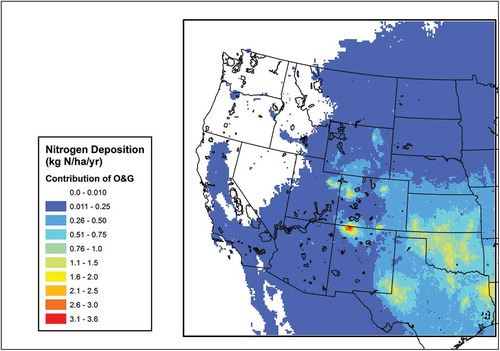
Figure 7. Modeled contribution of emissions associated with oil and gas production activity to the annual maximum W126 ozone concentration (ppm-hr). National parks and Class I areas are outlined in black.
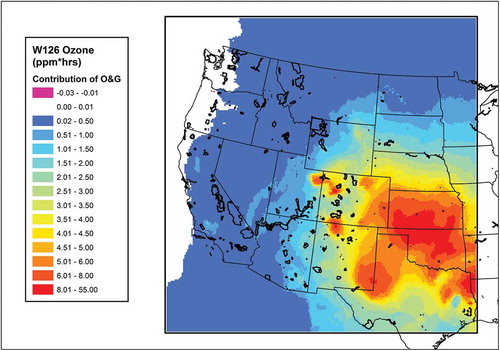
Table 1. Twenty national parks and Class I areas with the largest contribution of oil and gas emissions to the fourth highest daily maximum 8-hr ozone concentration (ppb).
Table 2. Twenty national parks and Class I areas with the largest contribution of oil and gas emissions to the W126 ozone metric (ppm-hr).
Table 3. Twenty national parks and Class I areas with the largest contribution of oil and gas emissions to the average visibility index ranked by the impact on the 20% haziest days (dv), and the number of days the modeled oil and gas impact to visibility is greater than 0.5 dv and 1.0 dv.
Table 4. Twenty national parks and Class I areas with the largest contribution of oil and gas emissions to total nitrogen deposition (Ndep).
Figure 8. Colorado national parks and Class I areas showing total modeled nitrogen deposition results both with (lighter red horizontal bar) and without (darker red horizontal bar) oil and gas emissions, plus the lower range critical load values for four endpoints (vertical bars).