
Figures & data
Table 1. Kuwait ambient air quality standards.
Table 2. Distribution of fixed site air monitoring stations in Kuwait.
Figure 1. Location of Kuwait and air monitoring stations.
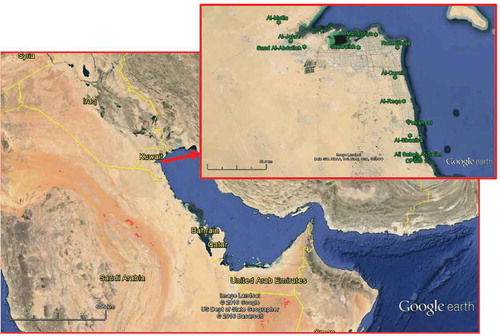
Figure 2. Proposed Kuwait air quality zones (Freeman et al., Citation2016).
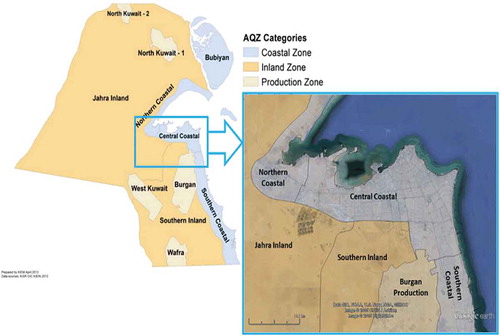
Figure 3. Breakdown of 8-hr O3 concentrations into compliance and exceedance distributions.
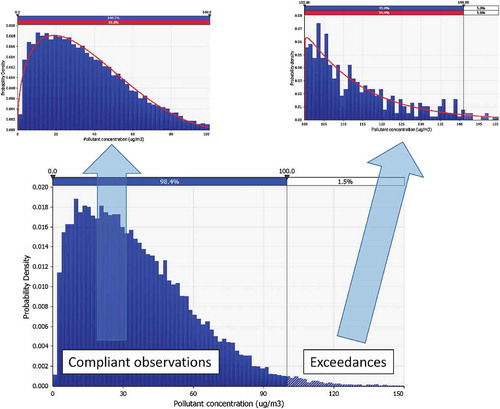
Table 3. Single station run exposure hours for compliance and exceedance concentrations.
Table 4. Composite weight of adults in Kuwait.
Figure 4. Composite model distributions of CDIs for the (a) 3 Strike method and (b) 99% Rule method.
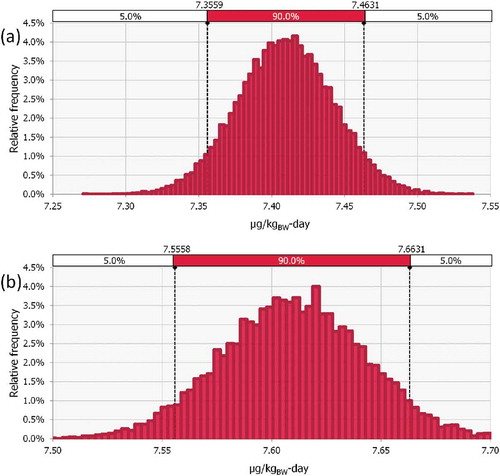
Figure 5. Flow chart of hypothesis testing procedures for single station case.
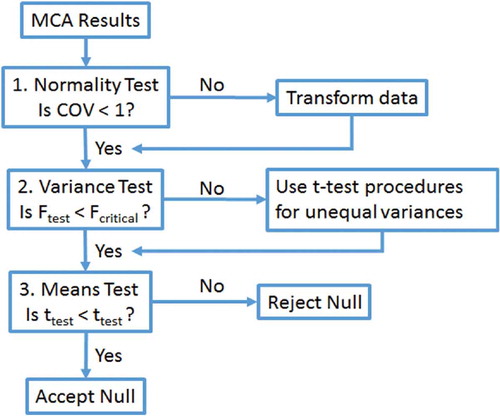
Table 5. Representative PDFs for single station case.
Table 6. Summary of normal distribution input parameters used to calculate CDFs for the single station case (in g-hr/m3).
Table 7. Single station CDIs (in μg/kgBW-day).
Table 8. Statistical testing for single station CDI case for 1 hr NO2.
Table 9. Statistical testing for single station CDI case for 8 hr O3.
Figure 6. Comparison of CDI distributions for 8-hr O3.
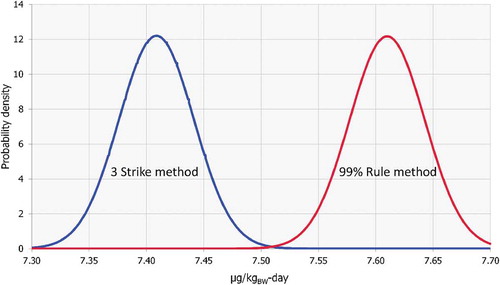
Table 10. Parameters for multiple station case of 1-hr NO2.
Table 11. Normal distribution inputs for multiple station case CDFs of 1-hr NO2.
Table 12. CDI statistics for multiple stations of 1-hr NO2.
Table 13. Statistical tests for multiple stations of 1-hr NO2.
Table 14. Parameters for multiple station case of 8-hr O3.
Table 15. Normal distribution inputs for multiple station case CDFs of 8-hr O3.
Table 16. CDI statistics for multiple stations of 8-hr O3.
Table 17. Statistical tests for multiple stations of 8-hr O3.
Table 18. Recommended uses for classification methods.