Figures & data
Figure 1. Study locations: (a) Adcock Elementary School, Las Vegas, NV; (b) Hunter High School, Salt Lake City, UT.
Table 1. Measurements at Adcock Elementary and Hunter High School.
Table 2. Summary statistics of hourly particle concentration, BC, and PM10 concentrations and wind speed at Adcock (April 19–June 19, 2013) and at Hunter (February 9–February 24, 2012).
Figure 2. Hourly averaged BC (µg/m3) and particle count (particles/cm3) concentrations at (a) Adcock Elementary, April 19–June 19, 2013 and (b) Hunter High, February 9–24, 2012.
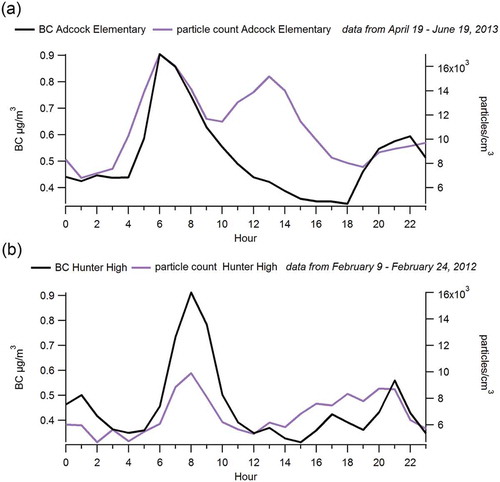
Figure 3. Hourly concentrations of (a) BC (µg/m3) and (b) particle count (particles/cm3) at Adcock Elementary compared to traffic volume (vehicles/hr), colored by the number of large vehicles (those greater than 40 feet in length).
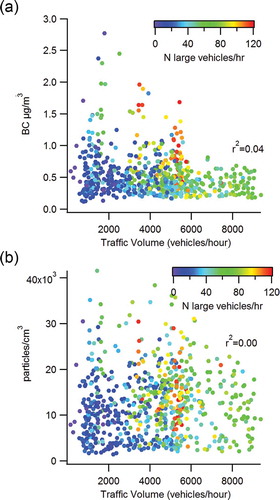
Figure 4. Wind speed (m/sec) at Adcock Elementary compared to hourly concentrations of (a) BC (µg/m3) (b) particle count (particles/cm3) and polar plots for (c) BC (µg/m3) and (d) particle count (particles/cm3).
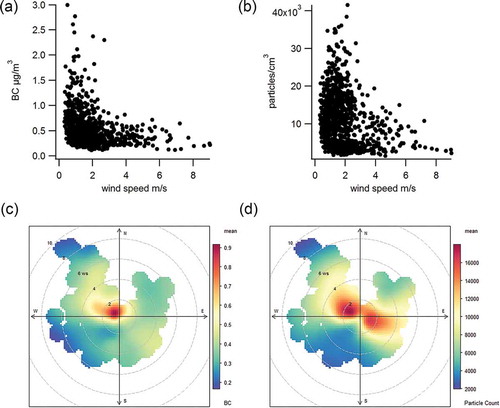
Figure 5. Wind speed (m/sec) at Hunter High compared to hourly concentrations of (a) BC (µg/m3) and (b) particle count (particles/cm3), and polar plots for (c) BC (µg/m3) and (d) particle count (particles/cm3). The axis ranges for and are the same as those in and in order to aid comparison between figures.
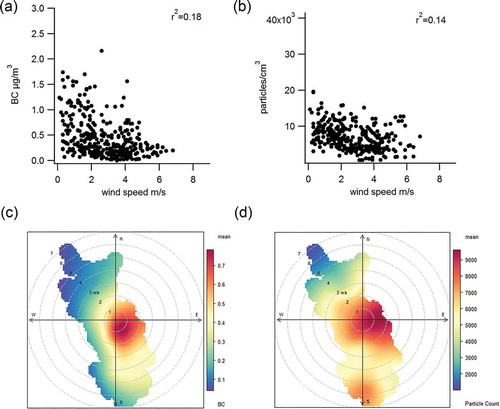
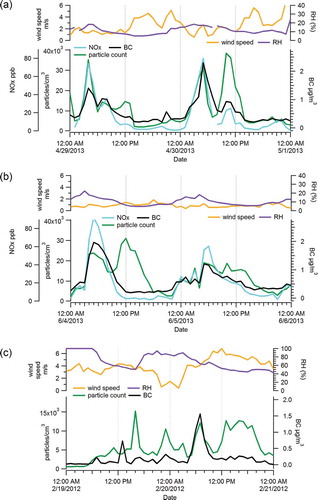
Figure 6. Hourly measurements of particle count (particles/cm3), BC (µg/m3), NOx (ppb, Adcock only), wind speed (m/sec), and RH (%) for (a) April 29 and 30, 2013, at Adcock (b) June 4 and 5, 2013, at Adcock and (c) February 19 and 20, 2012, at Hunter.