1,664
Views
33
CrossRef citations to date
0
Altmetric
Technical Papers

Revisiting nitrous acid (HONO) emission from on-road vehicles: A tunnel study with a mixed fleet

, , , , , , , & show all
Pages 797-805 | Received 04 Nov 2016, Accepted 04 Feb 2017, Published online: 01 Jun 2017

Figures & data

Figure 1. (a) Schematic diagram of the two-lane tunnel bore and points at which the pollutants were measured (not to scale). (b) The cross section of the tunnel bore (gases were sampled at the location of the star, around 1.2 m above ground).

Figure 1. (a) Schematic diagram of the two-lane tunnel bore and points at which the pollutants were measured (not to scale). (b) The cross section of the tunnel bore (gases were sampled at the location of the star, around 1.2 m above ground).

Figure 2. (a) Diurnal pattern of vehicle flow during the whole measurement. (b) Mix of engine types counted during the “emission-intensive hours” on March 13 and 14.
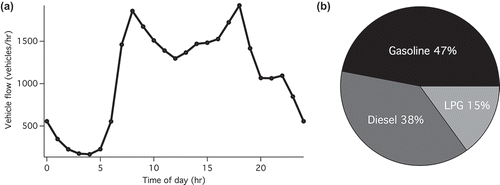
Figure 2. (a) Diurnal pattern of vehicle flow during the whole measurement. (b) Mix of engine types counted during the “emission-intensive hours” on March 13 and 14.

Figure 3. (a) Hourly averaged HONO/NOx as a function of time of day. As an example, the data point at time of day = 7 shows HONO/NOx averaged over 7:00 a.m. to 8:00 a.m. Error bars on this plot show 1σ variability. (b) The 10-min average HONO for 7 a.m. and 11 p.m., plotted against NOx, RMA regression line is [HONO] = 0.0134[NOx] – 1.8169 (N = 791).

Figure 3. (a) Hourly averaged HONO/NOx as a function of time of day. As an example, the data point at time of day = 7 shows HONO/NOx averaged over 7:00 a.m. to 8:00 a.m. Error bars on this plot show 1σ variability. (b) The 10-min average HONO for 7 a.m. and 11 p.m., plotted against NOx, RMA regression line is [HONO] = 0.0134[NOx] – 1.8169 (N = 791).

Figure 4. Mean HONO/NOx with 1σ variance at point B in different bins of ΔNO2/ΔNOx (0–0.15, 0.15–0.20, 0.20–0.25, 0.25–0.3, 0.3 or above) between point A and point B. The point in each bin is drawn in the middle of that bin on the horizontal axis.
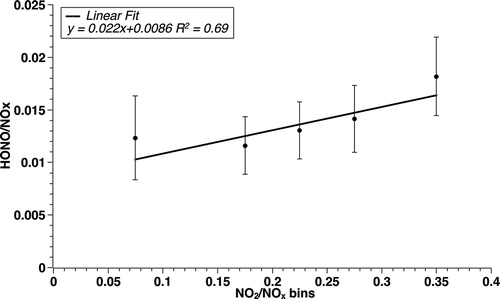
Figure 4. Mean HONO/NOx with 1σ variance at point B in different bins of ΔNO2/ΔNOx (0–0.15, 0.15–0.20, 0.20–0.25, 0.25–0.3, 0.3 or above) between point A and point B. The point in each bin is drawn in the middle of that bin on the horizontal axis.
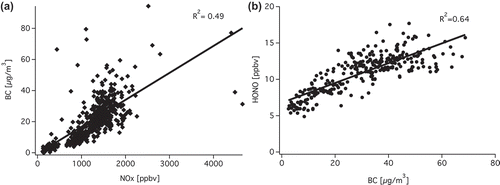
Figure 5. (a) Correlation of BC vs. NOx at point B from March 11 to March 14. (b) HONO vs. BC at point B from March 11 to March 14.

Figure 5. (a) Correlation of BC vs. NOx at point B from March 11 to March 14. (b) HONO vs. BC at point B from March 11 to March 14.

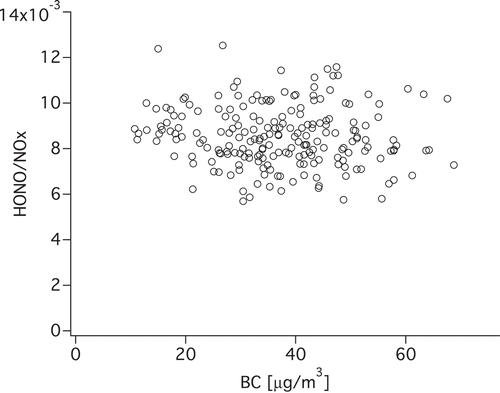
Figure 6. HONO/NOx vs. BC in the “emission-intensive hours” from March 11 to March 14.

Figure 6. HONO/NOx vs. BC in the “emission-intensive hours” from March 11 to March 14.

Reprints and Corporate Permissions

Please note: Selecting permissions does not provide access to the full text of the article, please see our help page How do I view content?

To request a reprint or corporate permissions for this article, please click on the relevant link below:

Academic Permissions

Please note: Selecting permissions does not provide access to the full text of the article, please see our help page How do I view content?

Obtain permissions instantly via Rightslink by clicking on the button below:

If you are unable to obtain permissions via Rightslink, please complete and submit this Permissions form. For more information, please visit our Permissions help page.