
Figures & data
Figure 1. Evolution of PM filter samplers from the 1950s to present, from upper left to lower right.
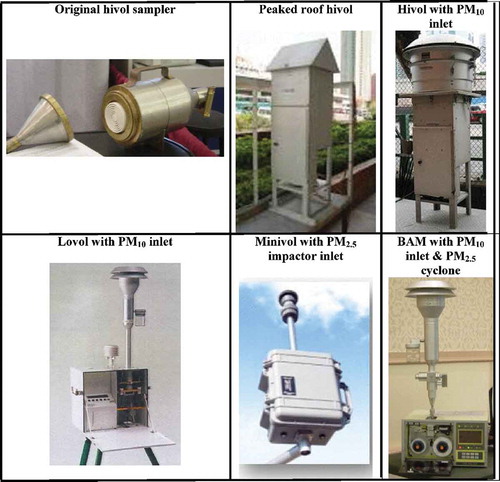
Figure 2. Filter samples are commonly acquired in PM compliance and speciation networks (IMPROVE, Citation2017; U.S.EPA, Citation2017i). Shading indicates the analyses and outputs that are currently obtained from these samples. Nonshaded boxes show additional possible analyses for source markers and secondary organic aerosol (SOA) end products applicable to sample remnants or solution extracts. More descriptions of analytical methods and specific chemical species are detailed in Chow and Watson (Citation2013) and Watson et al. (Citation2016) Abbreviations are: (1) FTIR, Fourier-transform infrared spectroscopy; (2) GRAV, gravimetric analysis; (3) IC-CD, ion chromatography with conductivity detection; (4) IC-PAD, IC with pulsed amperometric detection; (5) ICP-MS, inductively coupled plasma–mass spectrometry; (6) ID-TD-GC/MS, in situ derivatization–thermal desorption–gas chromatography/mass spectrometry; (7) TD-GC/MS, thermal desorption–gas chromatography/mass spectrometry; (8) TOC, total organic carbon analysis; (9) TOR/TOT, thermal–optical reflectance and transmittance for organic and elemental carbon (OC and EC); (10) UV-VIS, ultraviolet–visible light absorption (200–1100 nm) on filters; (11) XRF, x-ray fluorescence spectroscopy; (12) WSOC, water-soluble organic carbon; and (13) WSON, water-soluble organic nitrogen.
Figure 3. Schematic diagram of the data verification process (Environment Canada, Citation2015).
Figure 4. Examples of monitoring locations for selected pollutants from long-term continental U.S. networks. More specific maps by pollutant and location are available online (CIRA, Citation2017; EPA, Citation2017c).
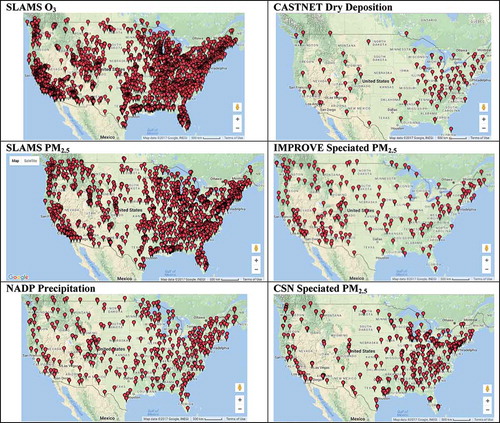
Table 1. Example field programs characterizing U.S. air quality after 1990.
Figure 5. Example of a contemporary SEARCH station measuring gases and particles along with surface meteorological parameters at nonurban location in Yorkville, GA, that acquired data during 1999–2016. (Photo courtesy of Eric Edgerton.)
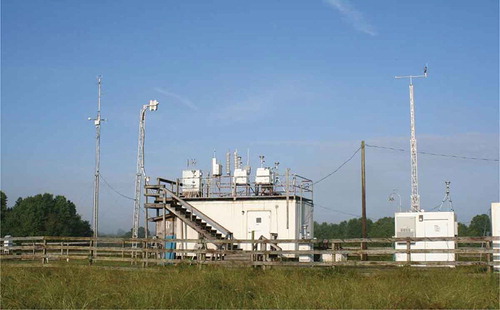
Table 2. Environmental Data Management Principles (NRC, 2007).