Figures & data
Table 1. List of sites within each EPA Region chosen for analysis in the tailored MAC study.
Figure 1. Comparison of Robotic OT21 and Benchtop OT21 IR and UV attenuation for filters previously analyzed on the Benchtop in 2010 and analyzed (a) in 2014 on the Robotic OT21 and (b) as recheck on the Robotic OT21 of a subsample (39) of these filters in 2016.
Figure 2. Comparison of Robotic OT21 and Benchtop OT21 analysis for unsampled and sampled filters illustrating the correlation for (a) raw transmission for MTL brand filters and (b) raw transmission for Whatman brand filters.
Figure 3. Raw transmission of blank filters analyzed for this study where individual lots are grouped and averaged. The count (n) is that of blank filters from the respective individual lot. The All Average Blank is that of every blank filter from the time frame of the archived filter analysis.
Figure 4. Raw IR transmission values at 880 nm as a function nominal filter weight for unsampled and exposed MTL filters in use at the time of this study.
Figure 5. Raw IR transmission reading at 880 nm for exposed filters as a function of PM2.5 mass concentration (μg/m3).
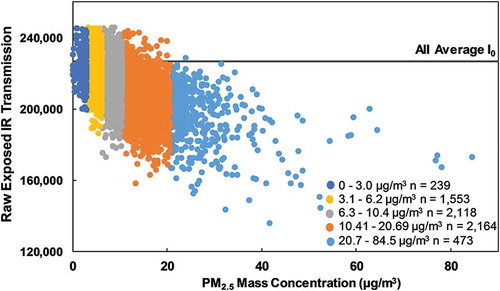
Figure 6. Investigation of a lot-specific derivation of MAC for lots 2010-5 and 2011-5 illustrating differences between using (a) Lot-Specific I0 and (b) All Average I0.
Figure 7. Correlation of the calculation of BC using an estimated MAC of 10 m2/g to the EC TOR by IMPROVE_A for the (a) 2011-4 and (b) 2011-5 Lot-Specific I0.
Figure 8. Image of the 10 EPA Regions as found on https://www.epa.gov/aboutepa/visiting-regional-office.
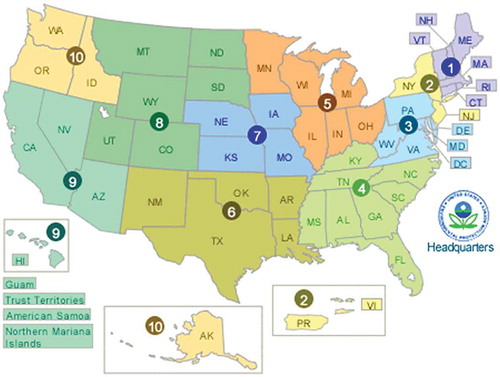
Table 2. MAC derivation for the 10 EPA Regions.
Figure 9. Seasonal variation of the (bars) MAC and (circles) correlation across all 10 EPA Regions.
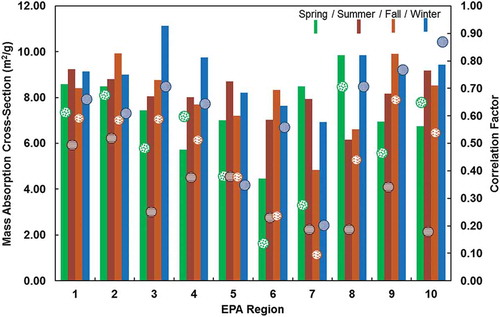
Table 3. Derived slope (MAC), y-intercept, and correlation for the seasonal variation in the relationship of light attenuation as a function of EC by IMPROVE_A TOR (μg/m3) for Region 7 and Region 10.
Figure 10. Average PM2.5 chemical compositions in EPA Regions 3, 7, and 10 during summer and winter seasons as measured by the CSN. The remaining species was calculated by subtracting the sum of the species indicated from the total PM2.5 mass concentration. Note that this category will include the multiplier for OC, soil components, and any undetermined species.
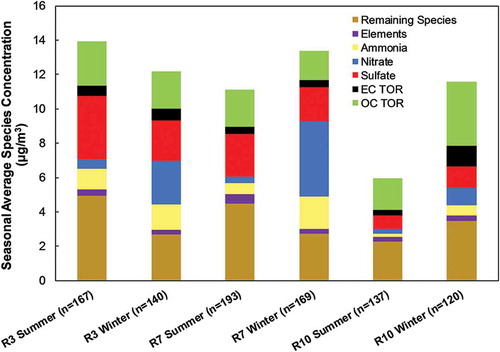
Figure 11. Seasonal evaluation of the fine soil fraction using aluminum (Al), calcium (Ca), iron (Fe), silicon (Si), and titanium (Ti) analyzed by XRF for (a) Region 1, (b) Region 2, (c) Region 3, (d) Region 4, (e) Region 5, (f) Region 6, (g) Region 7, (h) Region 8, (i) Region 9, and (j) Region 10. Note that the y-axis scales are same for all regions, except Region 6.
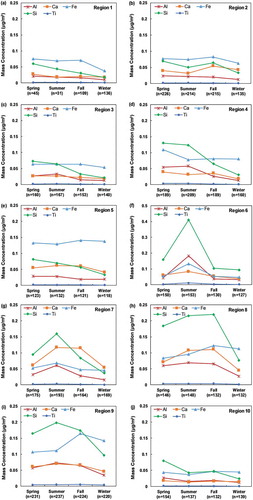
Figure 12. BC calculation using a constant MAC of 10 m2/g as a function of PM2.5 mass concentration (μg/m3) using (a) All Average I0 on archived Whatman filters and (b) filter-specific I0 on MTL filters in use during the study.
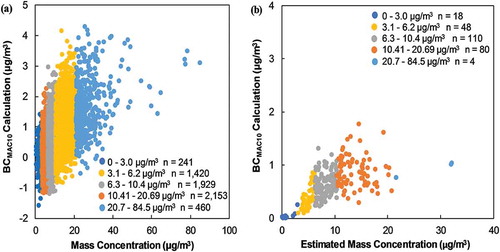
Table 4. Region 9 relationship of PM2.5 mass concentration (μg/m3) for the derived slope (MAC), y-intercept, and correlation.
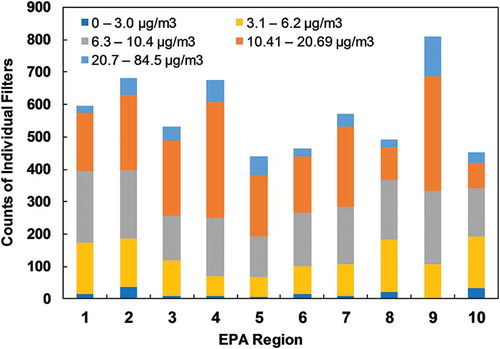
Figure 13. Counts of individual filters within each mass concentration range for EPA Regions for all the sampled filters analyzed in the MAC study.