Figures & data
Figure 1. Winter ozone requires three ingredients, a snowpack, topography conducive to persistent thermal inversions, and an extensive oil and natural gas extraction industry. The industry is the source of ozone precursors, the inversions keep ozone precursors trapped near the surface, and the albedo of the snowpack ensures adequate actinic flux for the production of ozone. The problem is exacerbated in the Uintah Basin by a feedback loop in which the albedo of the snowpack also stabilizes inversions, which stabilize the snowpack.
Figure 2. Time series of the 8-hr daily ozone maximum at Ouray, Utah, USA, from 31 July 2009 to 11 April 2016. The red trace shows the ozone concentration, whereas the blue trace shows a train of fitted polynomials centered at the summer solstice. The horizontal black line is the NAAQS for ozone, 70 ppb. Each vertical black line indicates 1 January. Five winter seasons out of seven, 2010, 2011, 2013, 2014, and 2016, saw many daily exceedances of the NAAQS.
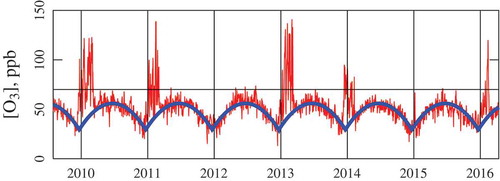
Figure 3. Map showing the Uintah Basin. White and blue crosses indicate locations of all surface temperature and snow depth stations consulted, whereas the blue crosses give the locations of those stations finally chosen, following an analysis explained in the text, as typically lying under the inversion layer. The town of Ouray is the site of the ozone observations used in this study. The vertical relief extends from about 1350 m above sea level (asl) (green) to about 4125 m asl (blue), with the floor of the basin at about 1400 m asl.
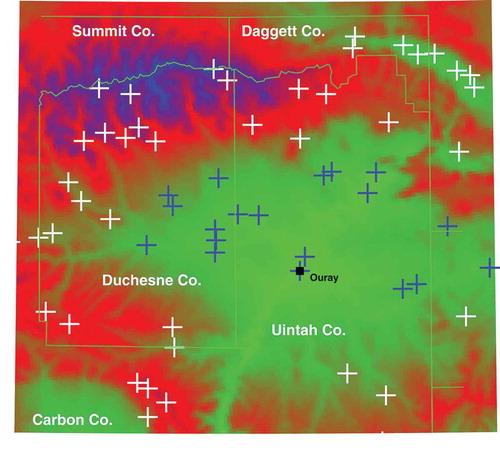
Figure 4. Mean daily maximum in the temperature as a function of altitude at the stations appearing in the map in , calculated for the first two weeks of February during each of the winters 2010 to 2016 inclusive. Open and filled symbols represent, respectively, averages taken over days when the 8-hr daily maximum ozone concentration either did or did not exceed 70 ppb. Because they typically lie below the inversion layer, one set of stations, represented with filled squares, behaves differently than another set, represented as filled circles. Lines with indicated slopes are the least-squares fits to filled circles and filled squares, respectively.
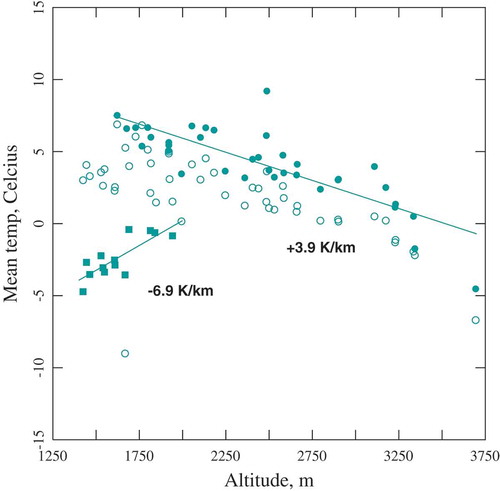
Figure 5. Time-series plots of the pseudo-lapse rate, K/km, and the average snow depth, mm. Vertical lines indicate 1 January.
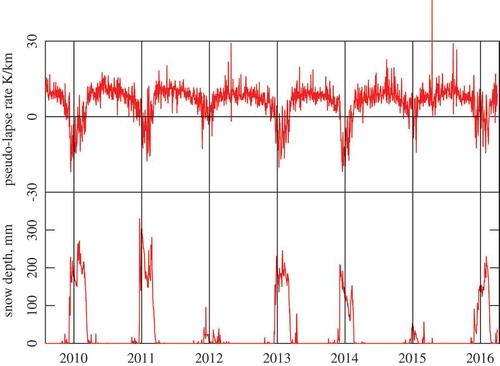
Figure 6. Probability that any given day has an ozone exceedance, and average of the daily 8-hr maximum ozone concentration during an exceedance, at different intervals during the winter.
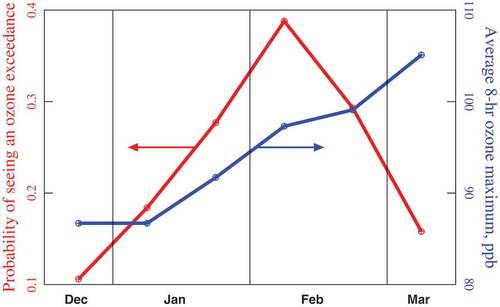
Figure 7. Histograms of the distribution in pseudo-lapse rate during ozone exceedance days at different periods throughout the winter. The number of exceedance days represented by each bar is also shown. Early winter ozone requires more intense inversions than late winter ozone.
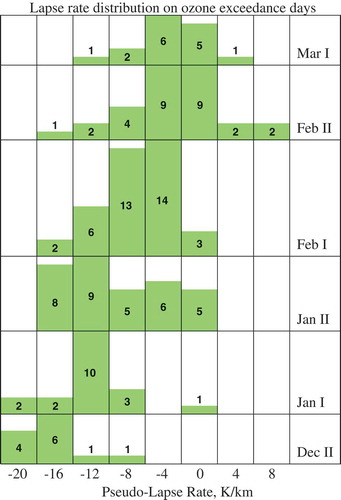
Figure 8. Uintah basin oil and natural gas activity. Total petroleum production (c) represents the sum of natural gas (a) and oil (b) in tonnage units. The spud count (d) is an estimate of the number of drilling rigs in operation on any given day.
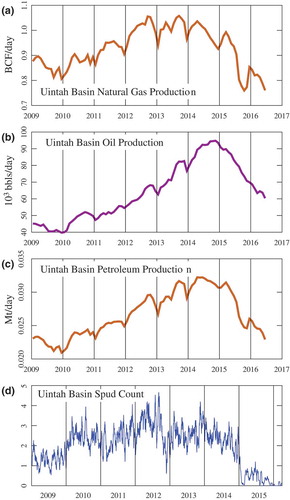
Table 1. Statistics on each of the data sets.
Table 2. Summary of the models.
Figure 9. Correlations between measured and predicted ozone. (a) Uintah-5, N = 629, σ = 12.26 ppb, R2 = 0.75. (b) Uintah-8, N = 629, σ = 11.36 ppb, R2 = 0.78.
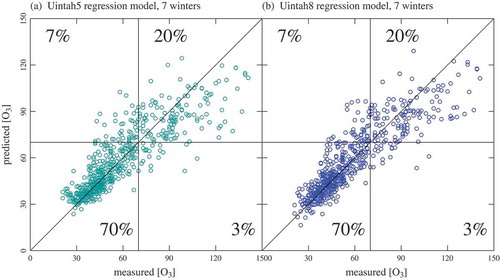
Figure 10. Time-series comparisons between actual and predicted ozone concentrations. Red = observation; blue = Uintah-8 prediction.
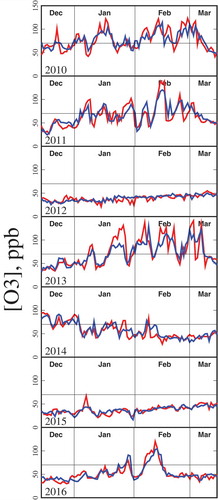
Figure 11. Sensitivity of Uintah-8 to each of its independent variables.
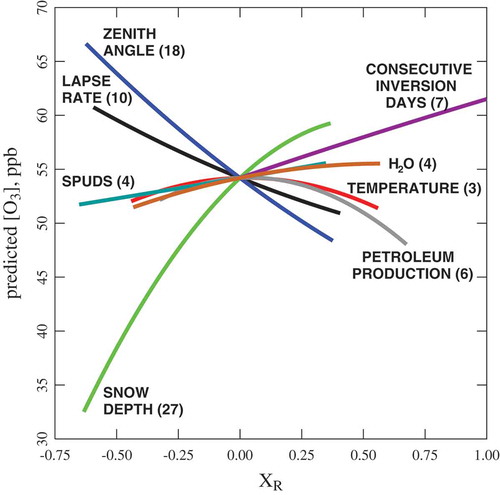
Table 3. Predicted odds for various outcomes.
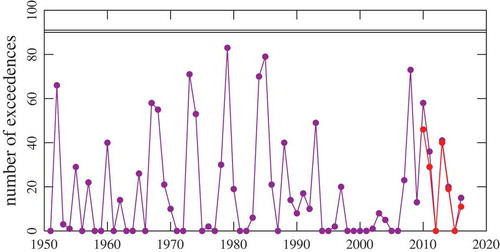
Figure 12. Predictions by Uintah-5 over the past 66 years of the number of exceedance days per year under the assumption that each year had modern petroleum production. Mauve = prediction; red = actual number of exceedance days.